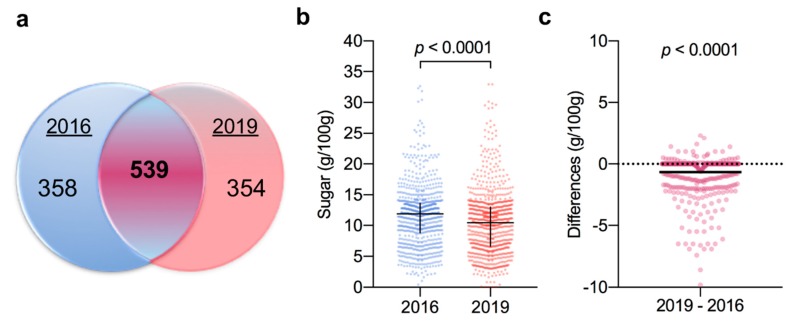
Figure 1.
Comparison of total sugar content in yogurt products sold in 2016 and 2019. (a) Analysis of product names and brands identifies 539 products sold in both years. (b) Distribution of sugar content of all products from 2016 (n = 898) and 2019 (n = 893). Data were analysed using the Mann–Whitney test; black cross indicates median and interquartile range. (c) Difference plot of the change in sugar content between the products sold both in 2019 and 2016 (n = 539). Data were analysed using the Wilcoxon matched-pairs signed-rank test; solid black line indicates mean change (−0.6113) between 2016 and 2019.

