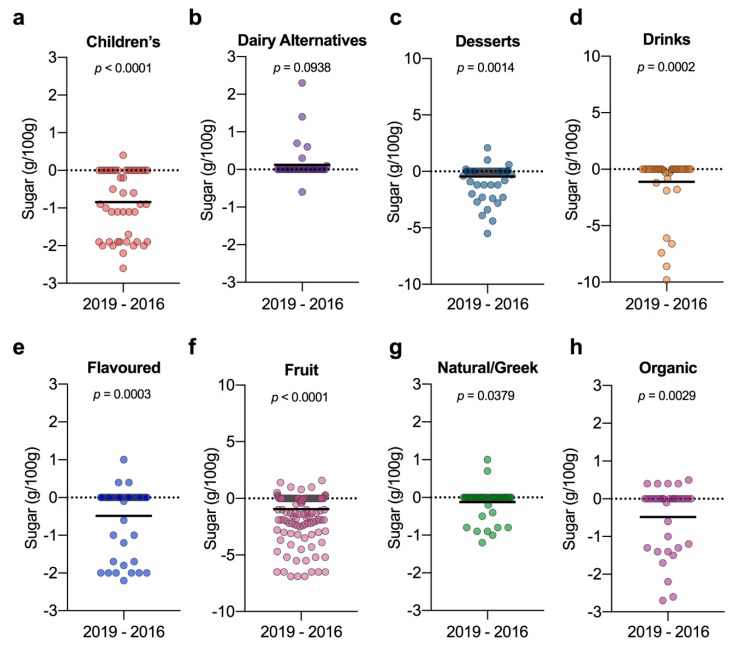
Figure 2.
Difference plots for each category showing the change in total sugar content between yogurt products sold both in 2019 and 2016. (a) Children’s (n = 46); (b) dairy alternatives (n = 39); (c) desserts (n = 77); (d) drinks (n = 40); (e) flavoured (n = 60); (f) fruit (n = 195); (g) natural/Greek (n = 47); (h) organic (n = 35). Data were analysed using the Wilcoxon matched-pairs signed-rank test; solid black line indicates mean change between 2016 and 2019.

