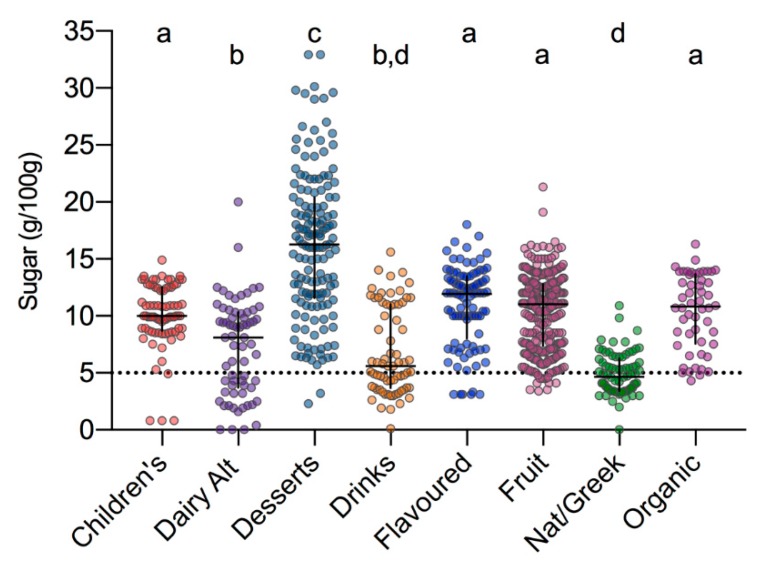
Figure 3.
Total sugar content of UK yogurt products across categories. Black cross indicates median and interquartile range. Data were tested for normality and analysed using the Kruskal–Wallis and Dunn’s multiple comparison tests; categories not assigned the same lettering (a–d) are significantly different. Dashed line indicates threshold defined by European Union (EU) regulations for low-sugar nutrition claim [17].

