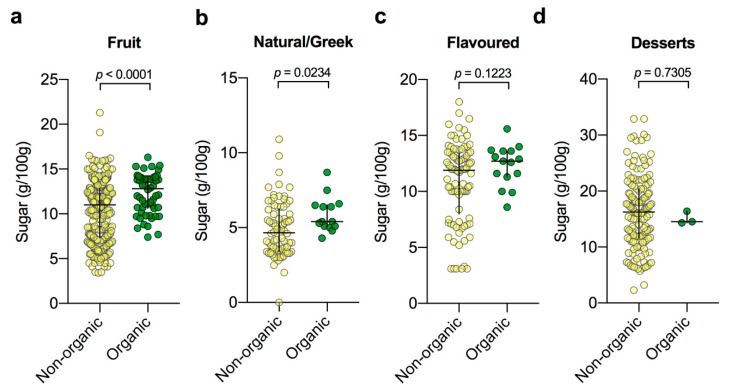
Figure 4.
Sugar contents of organic yogurts subdivided by category in comparison to non-organic yogurts. (a) Fruit non-organic (n = 305) vs. organic (n = 56); (b) natural/Greek non-organic (n = 78) vs. organic (n = 14); (c) flavoured non-organic (n = 93) vs. organic (n = 15); (d) dessert non-organic (n = 150) vs. organic (n = 3). Data were tested for normality and analysed appropriately using either the Mann–Whitney or unpaired t-test. The black cross indicates median and interquartile range.

