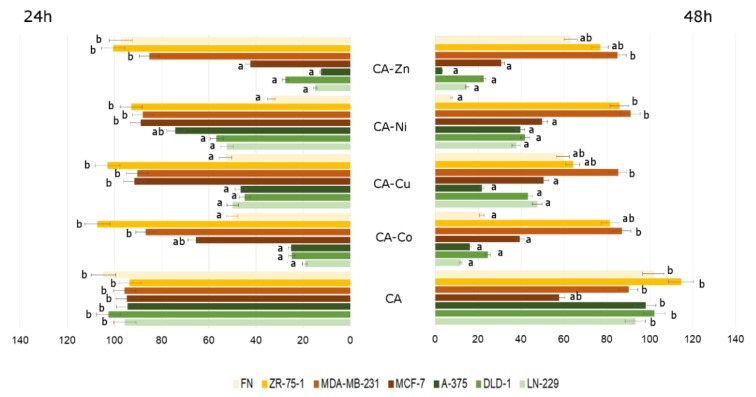
Figure 8.
The viability of LN-229, DLD-1, A-375, FN, MCF-7, MDA-MB-231, and ZR-75-1 cell lines treated with different concentrations of CA and CA–metal (Cu, Zn, Ni, Co) complexes for 24 and 48 h. The results represent means for pooled triplicate values from three independent experiments. Significant alterations are expressed relative to control untreated cells (marked with asterisks). Statistical significance was considered if * p < 0.05.

