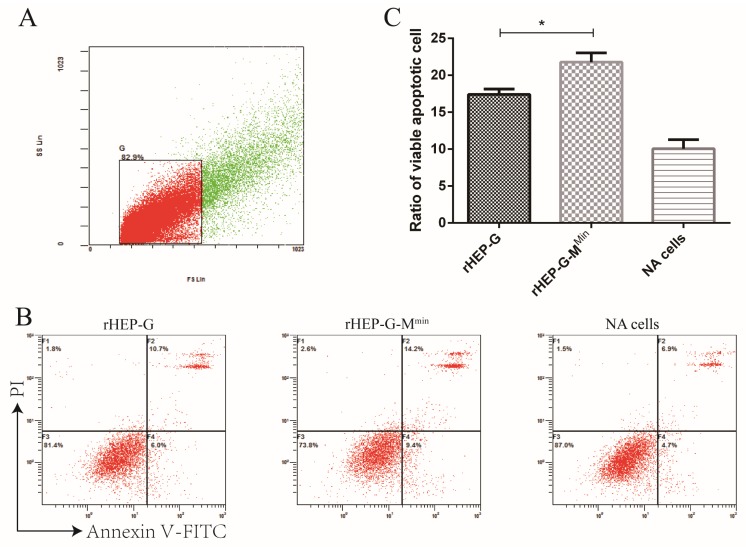
Figure 7.
Cell apoptosis induced by RABV. NA cells were infected with rHEP-G, rHEP-G-Mmin, or mock infected at an MOI of 3 and cells were harvested by trypsin digestion at 24 hpi. Cells were stained with Annexin-V and PI for flow cytometry detection of apoptosis. Data were collected and analyzed with a Beckman FC 500 flow cytometer (Beckman Coulter) and CXP analysis software (Beckman Coulter). (A) Gating strategy to identify single NA cells. (B) Representative flow cytometry plots showing apoptotic cells in the lower right and upper right quadrants are shown. (C) Percentage of apoptotic cells amongst the total number of cells are shown as the mean ± SD, n = 4. Asterisks indicate significant differences between the two groups, calculated through a Student’s t test (* p < 0.05).

