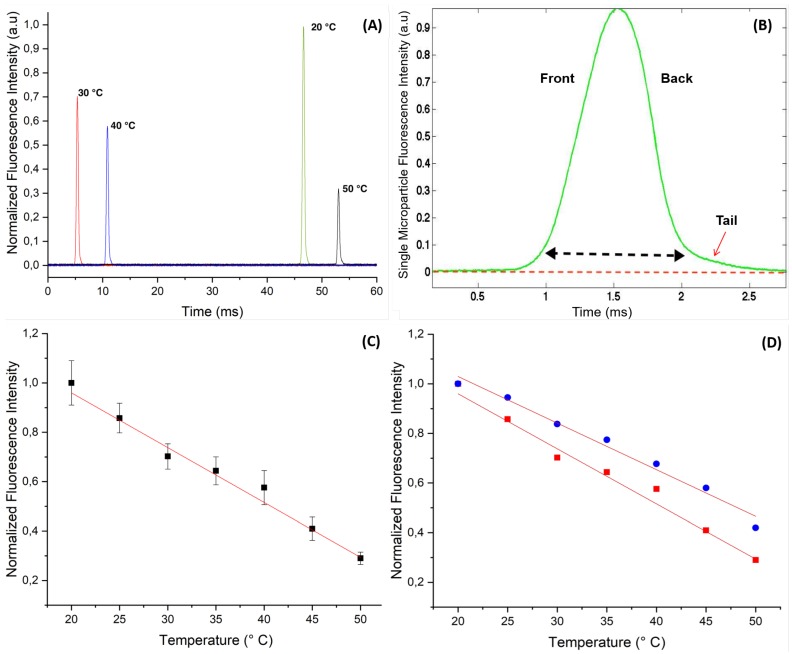
Figure 4.
(A) Recorded fluorescence intensity peaks at different temperature from confined rhodamine B dye in flowing ZnO microcapsules (with a size of 17.8 μm) along a 22 μm wide micro-channel constriction area; (B) High-magnification of the fluorescence intensity peak vs. time of doped ZnO microcapsules with rhodamine B; (C) Plot of the linear decrease of the normalized fluorescence intensity of doped ZnO microparticles with rhodamine B vs. temperature; (D) Comparison of the change of fluorescence of RhB vs. temperature in flowing RhB doped ZnO microparticles (squares, red curve) and flowing RhB doped ZnO microdroplets (circles, blue curve), the slope of the two curves are very close and in very good agreement with the literature data: /°C and /°C, respectively.

