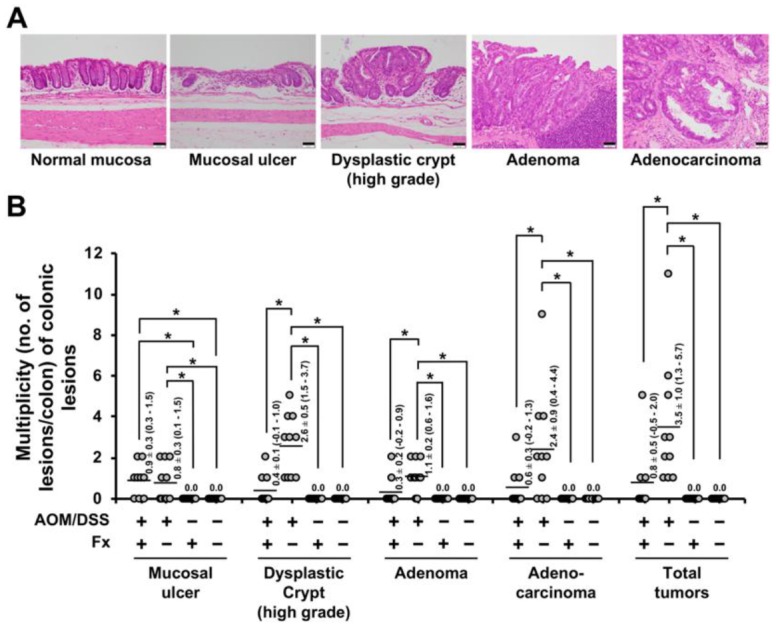
Figure 2.

Multiplicity (no. of lesion/colon) of colonic lesions. (A) A representative photograph is shown for normal mucosa, mucosal damage, dysplastic crypt (high grade), adenoma and adenocarcinoma. Bar, 50 μm. (B) Number of colonic lesions per mouse. Averages of multiplicity (flat bars) are shown as a Mean ± SE (n = 9–10). The parentheses are 95% confidence intervals. Significant difference was performed by one-way ANOVA with a Tukey-Kramer post-hoc test. * p < 0.05. Individual colonic lesion was diagnosed by a pathologist (co-author, Takuji Tanaka).
