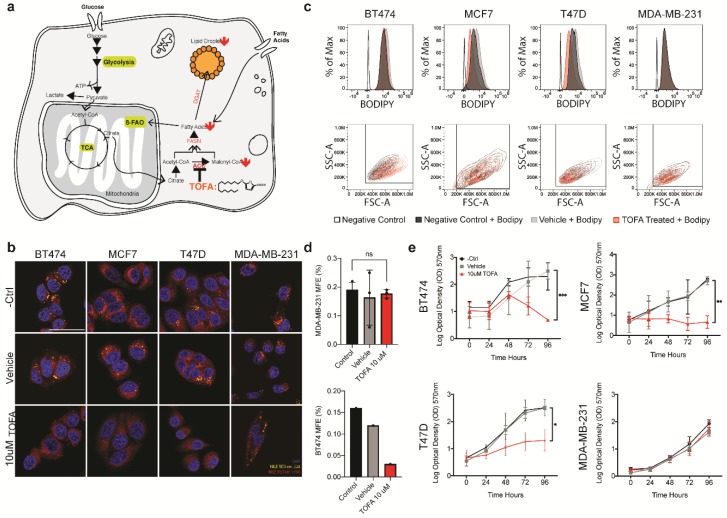
Figure 4.
TOFA treatment reveals lipid metabolic addiction in a panel of breast cancer cell lines. (a) Schematic depicting the effects of TOFA treatment on lipid metabolism. (b) Confocal microscopy of lipid droplets in the cell lines used in this study. Lipid droplets were visualized for control, vehicle, and following 48 h of 10 μM TOFA treated with Nile Red. The scale bar represents 50 μm. (c) FACS profile of cells treated with media, vehicle or TOFA for 48 h. From top to bottom, BODIPYTM signal across the treatment groups, side scatter vs. forward scatter plots across the treatment groups. (d) Second generation mammosphere forming efficiency for MDA-MB-231 and BT474 following pre-treatment with TOFA, vehicle or regular growth media (n = 2). (e) Growth of each cell line over time in the presence of 10 μM TOFA, vehicle or growth media. Significance was calculated using the two-tailed t-test. * p < 0.05, ** p < 0.01, *** p < 0.001.

