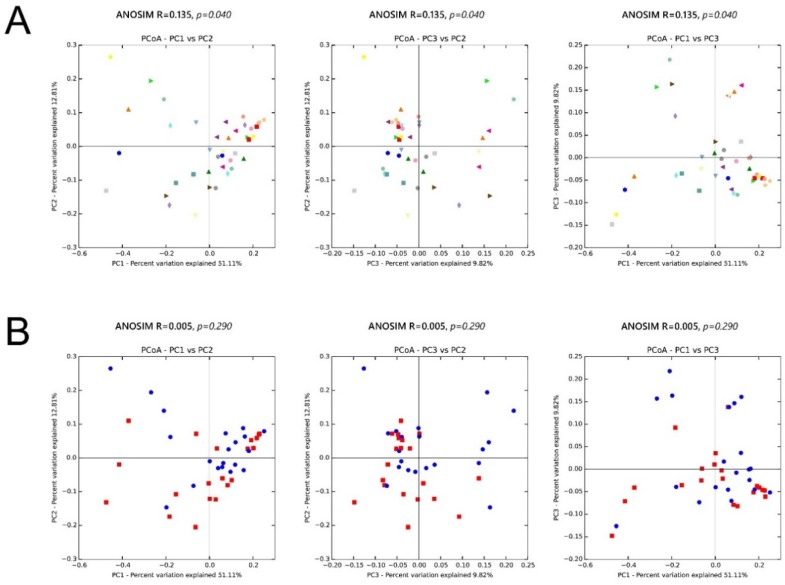
Figure 10.
Microbiota β diversity (between-sample microbial diversity) based on principal coordinate analysis (PCoA) of weighted UniFrac distances. Two-dimensional PCoA plots display inter-sample distances by three principal coordinates (PC1, PC2, and PC3) with labeling of individual samples by (A) patient and (B) treatment, for patients 1 to 20. Principal coordinates, calculated from a distance matrix of weighted Unifrac distances, have no units.

