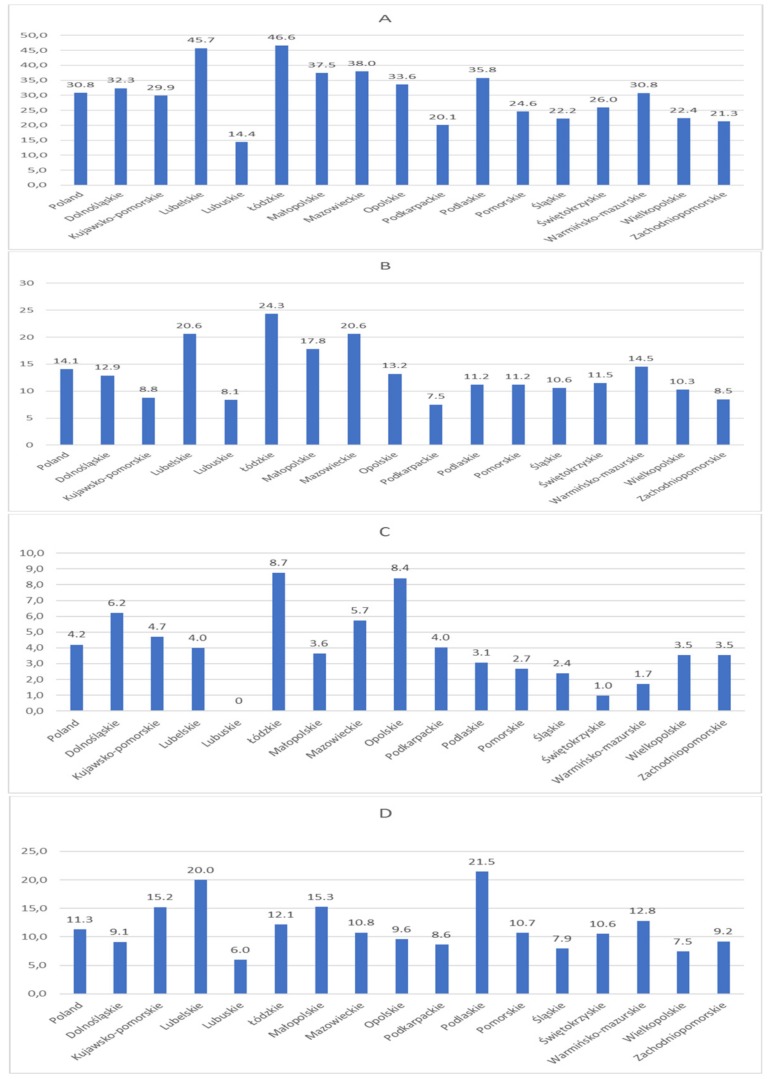
Figure A1.
Geographical distribution of patients with pulmonary arterial hypertension (A) and its most frequent subgroups including idiopathic pulmonary arterial hypertension (B), pulmonary arterial hypertension associated with connective tissue disease (C) and pulmonary arterial hypertension associated with congenital heart disease (D).

