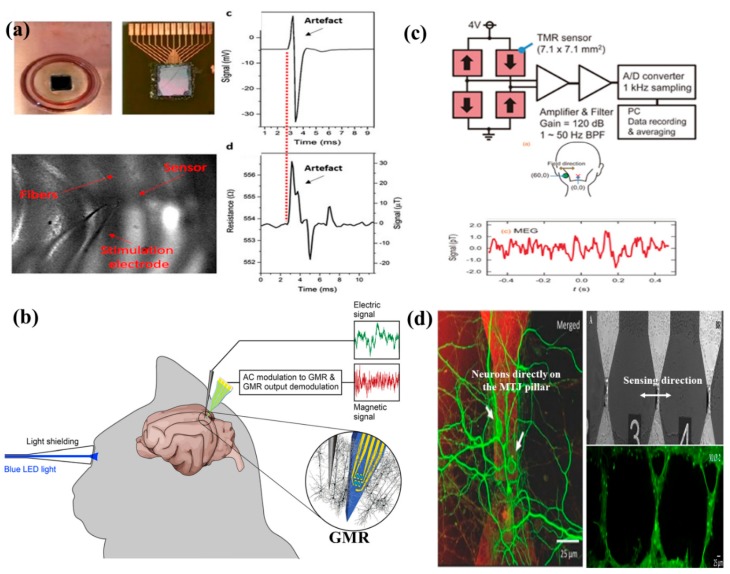
Figure 16.
(a) MTJ sensor array and the in vitro experimental set-up demonstrating the neural response. The signal (in mV) and the resistance (in Ω) are the local field potential (LFP) recordings and MTJ signal response, respectively. The shape of both the signal resembles each other [141]; (b) in vivo experimental set-up to record neural response from rat cerebral cortex [140]; (c) Four TMR sensors arranged in Wheatstone Bridge configuration along with neural response as recorded by the sensor configuration (in pT) [142]. (a) Reprinted under a Creative Commons Attribution (CC BY) license. (b) Reprinted with permission from Elsevier 2017. (c) Reprinted under the terms of the Creative Commons Attribution 4.0 license. (d) Orientation of the axons of the neurons perpendicular to the sensing direction of the MTJ pillars to facilitate most optimized detection of the magnetic field generated by the ionic currents flowing through the axons [67].

