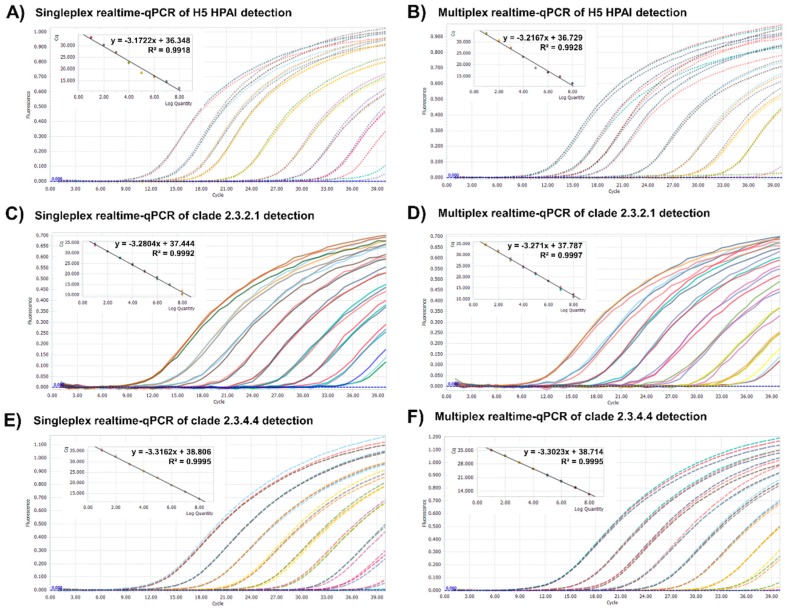
Figure 2.
Amplification plots and standard curves of the singleplex and multiplex realtime-qPCR assays using target-specific plasmid DNA. Comparison of the singleplex (A,C,E) and multiplex (B,D,F) realtime-qPCR assays was performed using standard plasmids corresponding to H5 HPAI and clades 2.3.4.4 and 2.3.2.1; each plasmid solution was serially diluted down to 5 × 10⁸ to 5 × 100 copies of plasmid DNA/microliter. The cycle threshold in amplification plots, correlation coefficient (R2) and slope of the standard curve for the assays were drawn automatically by Lightcycler 96 software. Each concentration had triple replicates.

