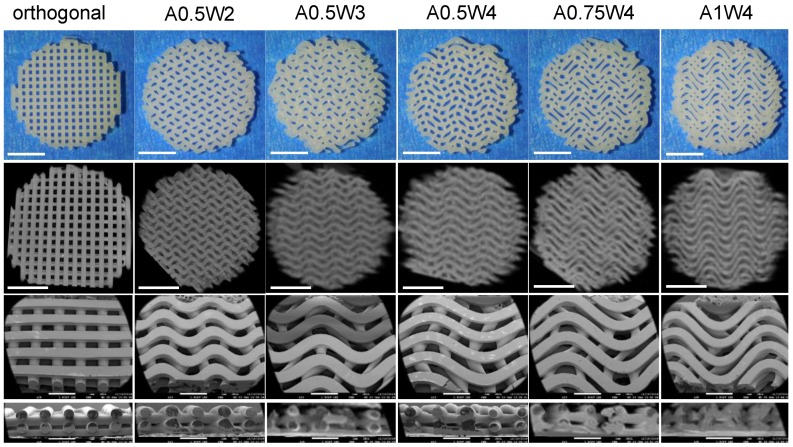
Figure 2.
Images of the scaffolds. From the top to bottom row, images correspond to pictures (top view), micro-computed tomography (micro-CT) images (top view), scanning electron microscope (SEM) images, and SEM cross-section images. Scale bars are 500 microns for pictures and micro-CT images and 1 mm for SEM images.

