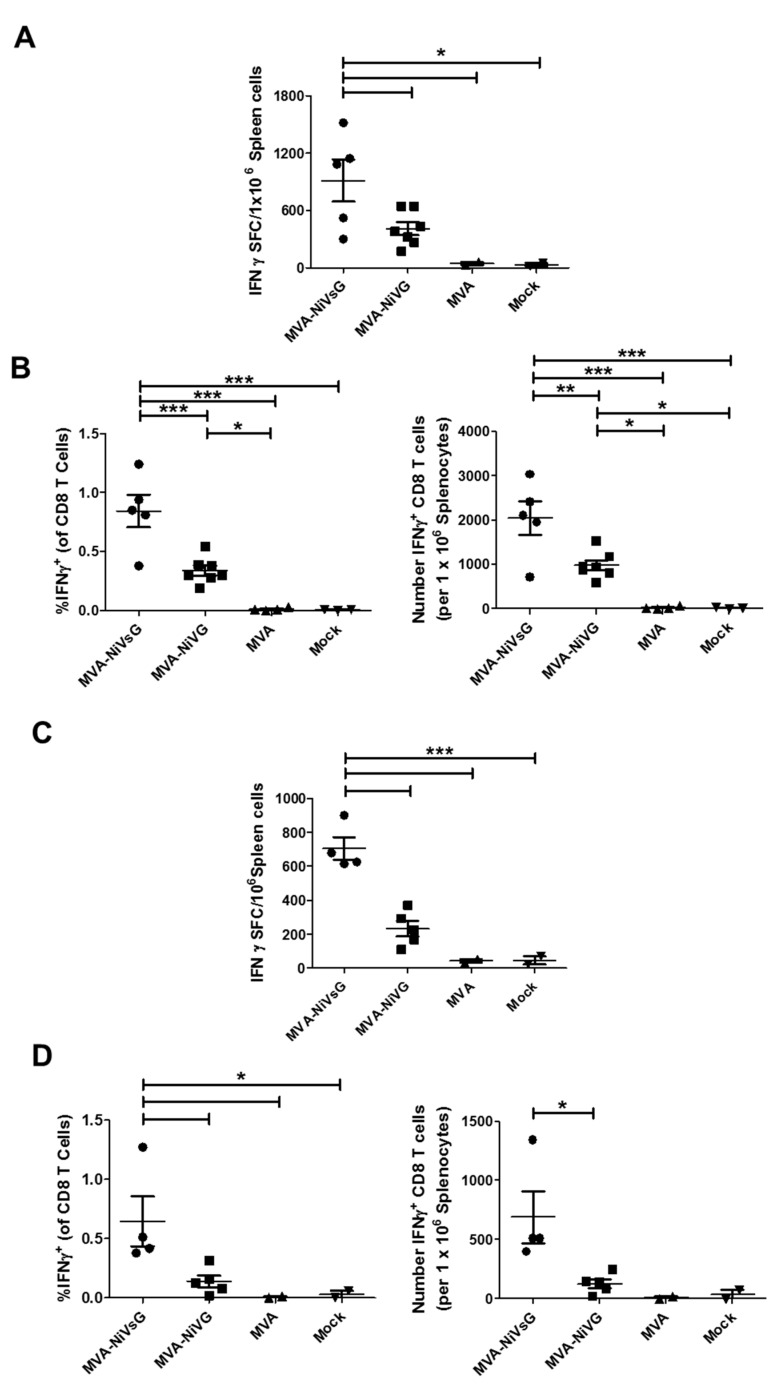
Figure 5.
Activation of antigen-specific T cells after immunization with the recombinant MVA candidate vaccines expressing NiV-G. Groups of IFNAR−/− mice (n = 2–7) were immunized with MVA–NiVsG, MVA–NiV-G, MVA, or saline (mock) via the i.m. route using a prime-only or the previously described prime-boost schedule. Spleens were collected and single cell suspensions were prepared 8 days after the final immunization. Total splenocytes were restimulated with the H2-b-restricted peptide of NiV-G 9.3 (RSTDNQAVI) (Table 2) and measured by ELISPOT assay and IFN-γ ICS plus FACS analysis. (A,B) Antigen-specific CD8 T cell response induced by prime-boost immunization. (A) IFN-γ SFC for stimulated splenocytes measured by ELISPOT assay. (B) IFN-γ production by stimulated splenic CD8 T cell measured by ICS and FACS analysis. Graphs show frequency and absolute number (per 106 splenocytes) of antigen-specific IFN-γ+ CD8 T cells. (C,D) Antigen-specific CD8 T cell response induced by prime immunization. (C) IFN-γ SFC for stimulated splenocytes measured by ELISPOT assay. (D) Frequency and absolute number (per 106 splenocytes) of antigen-specific CD8 T cells measured by IFN-γ ICS plus FACS analysis. Differences between individual groups were analyzed by one-way ANOVA and Tukey post-hoc test. Asterisks represent statistically significant differences between two groups. * p < 0.05, ** p < 0.01, *** p < 0.001.

