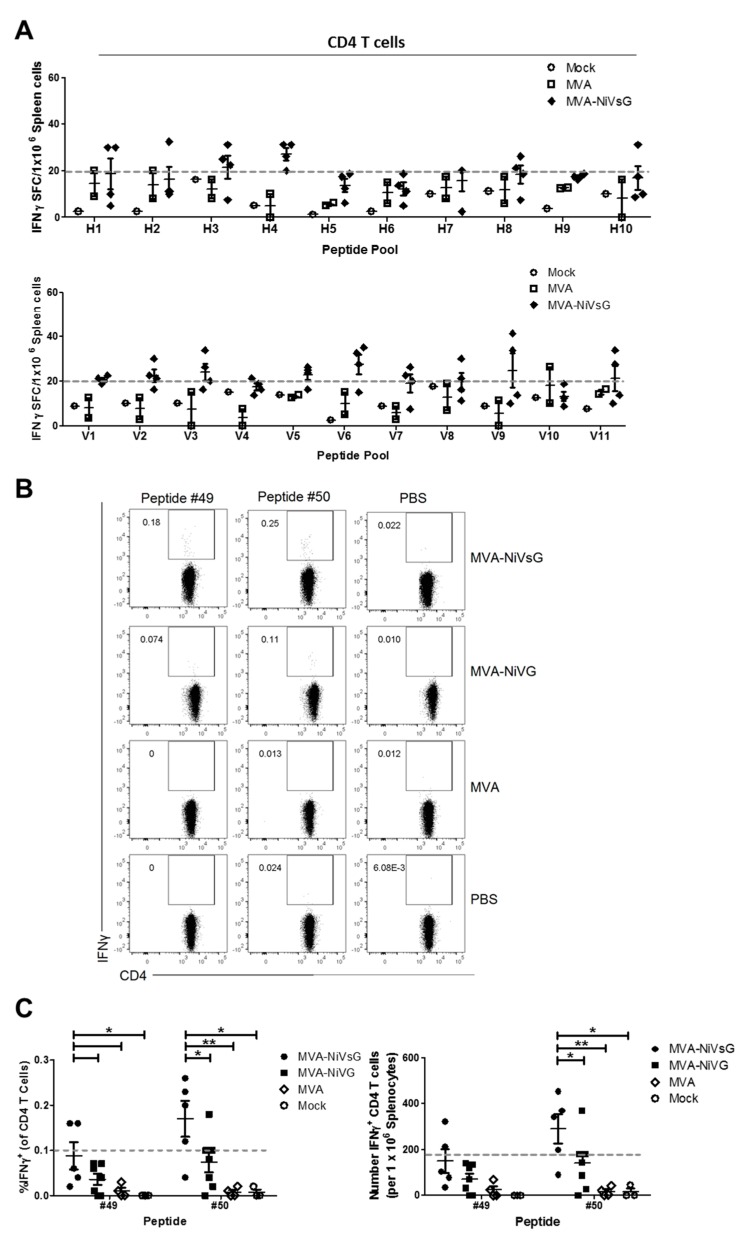
Figure 6.
Activation of antigen-specific CD4 T cells after immunization with the recombinant MVA candidate vaccines expressing NiV-G or NiV-sG. Groups of IFNAR−/− mice (n = 2–7) were immunized twice with MVA–NiVsG, MVA–NiV-G, MVA, or saline (mock) via the i.p. or i.m. route over a 21 day period. Eight days after the final immunization, CD4 T cell-enriched splenocytes or total splenocytes were restimulated and measured by IFN-γ ELISPOT assay or IFN-γ intracellular cytokine staining (ICS) plus FACS analysis. (A) Screening for H2-IAb-restricted T cell epitopes of NiV-G in CD4 T cell-enriched splenocytes obtained from i.p. immunized mice. T cell responses were measured by IFN-γ ELISPOT assay. Graph shows IFN-γ SFC of CD4 T cell-enriched splenocytes stimulated with peptide pools H1–H10 and V1–V11. The grey dashed line represents the group mean cut off value (20 IFN-γ SFC/106 cells) for identifying positive peptide pools. (B,C) Identification of H2-IAb-restricted candidate epitopes of NiV-G by IFN-γ ICS and FACS analysis. Total splenocytes from i.m. immunized mice were restimulated with two promising candidate H2-IAb-restricted 15mer peptides, #49 (LFMTNVWTPPNPNTV) and #50 (NVWTPPNPNTVYHCS), identified by peptide pool screening and in silico H2-IAb-binding predictions using the IEDB database. (B) Representative flow cytometry dot plots showing IFN-γ production in the splenic CD4 T cell compartment. (C) Frequency and absolute number (per 106 splenocytes) of IFN-γ+ CD4 T cells. Dashed line on graphs represent the cut off for definitively positive samples. Differences between individual groups were analyzed by one-way ANOVA and Tukey post-hoc test. Asterisks represent statistically significant differences between two groups for a specific peptide. * p < 0.05, ** p < 0.01.

