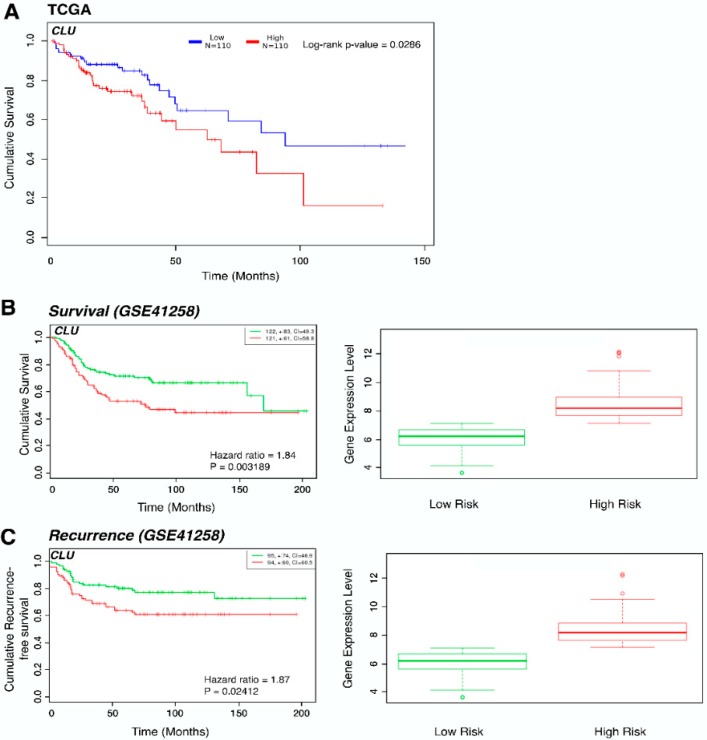
Figure 3.
CLU expression in colon adenocarcinoma patients is associated with decreased overall survival. (A): Kaplan–Meier survival plot comparing The Cancer Genome Atlas (TCGA) colon adenocarcinoma patients with high (n = 110) and low (n = 110) expression of CLU using the OncoLnc tool. The associated log-rank p-value is 0.0286. (B): Kaplan–Meier survival plot for high- (red, n = 121) and low- (green, n = 122) risk groups in GSE41258 database by SurvExpress tool shows cumulative survival against time (months) and the box plot shows the corresponding CLU expression across groups. The number of individuals, the number of censored, and the CI of each risk group are shown in the top-right insets. Censoring samples are shown as “+” marks. (C): Kaplan–Meier survival plot for high- (red, n = 95) and low- (green, n = 94) risk groups in GSE41258 database by SurvExpress tool shows cumulative recurrence-free survival against time (months) and the box plot shows the corresponding CLU expression across groups. The number of individuals, the number of censored, and the CI of each risk group are shown in the top-right insets. Censoring samples are shown as “+” marks.

