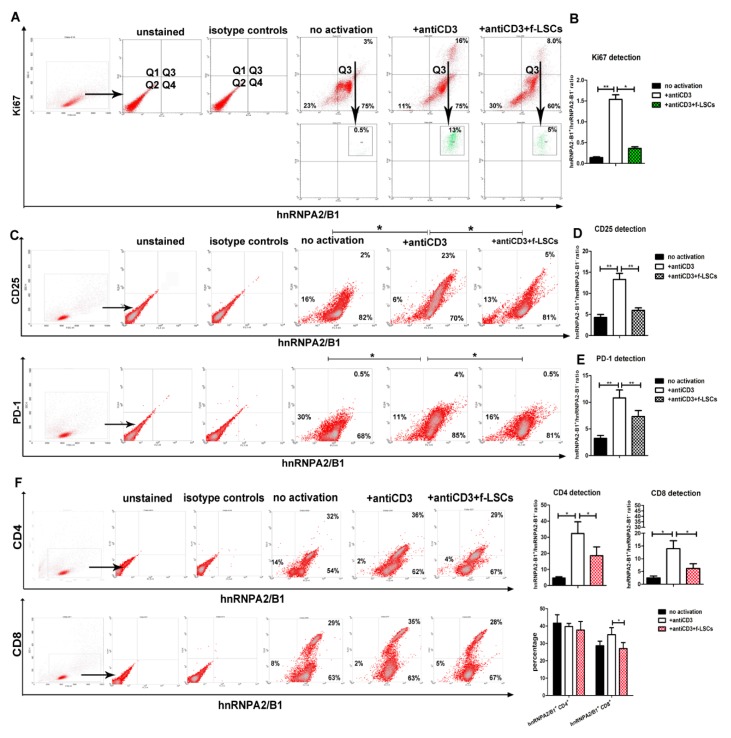
Figure 4.
hnRNPA2/B1 downmodulation affects Ki67+, CD25+, PD-1+, CD8+ lymphocytes of AED patients. (A) Representative dot plots of activated PBMCs collected by AED patients and stained for Ki67 and hnRNPA2/B1. In the upper right quadrant (Q3) of the dot plots, the gating strategy is shown. (B) In histogram, the dual staining Ki67-hnRNPA2/B1 of AED PBMCs, reported as hnRNPA2/B1+:hnRNPA2/B1− ratio is shown. (C) A comparison of FASC analysis for the activation markers CD25, PD-1 and hnRNPA2/B1 is reported. (D) and (E) In histograms, the dual staining CD25-hnRNPA2/B1 and PD-1-hnRNPA2/B1 of AED PBMCs, reported as hnRNPA2/B1+:hnRNPA2/B1− ratios, are respectively shown. (F) Representative dot plot shows the percentages of hnRNP A2/B1 coexpression with the CD4+ or CD8+ T cell markers (left panels). The numbers in the corner of quadrants correspond to the percentage of related cell population inside any quadrant. The same data are reported in a percentage graph (lower-right panel) or calculated as hnRNPA2/B1+:hnRNPA2/B1 ratio in each condition during the CD4 and the CD8 detection (upper-right panel). The data show the averaged results from five independent experiments and are presented as means ± SE in each histogram. * p < 0.05, ** p < 0.02, *** p < 0.001.

