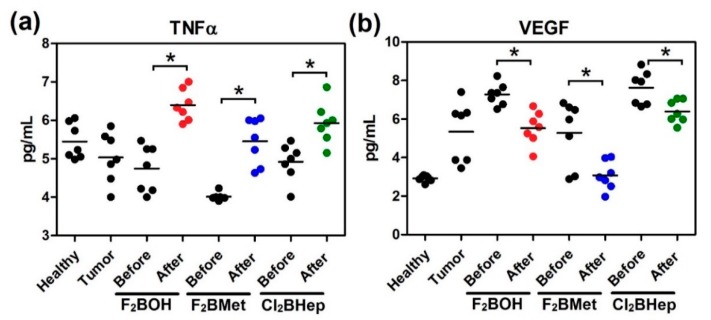
Figure 13.
Concentrations of (a) TNFα; (b) VEGF in the serum of mice before and after optimal PDT protocol with F2BOH (V-PDT), F2BMet (V-PDT) and Cl2BHep (C-PDT) as well as healthy mice and mice bearing CT26 tumor controls. Luminex, N = 6–7; each dot represents one individual, line represents a mean; * p < 0.05.

