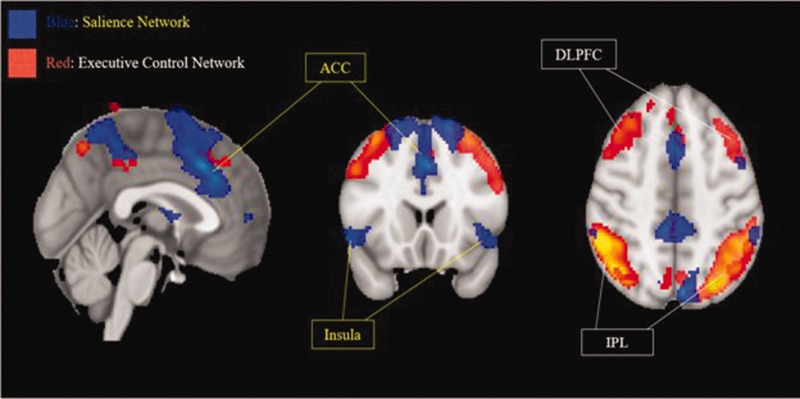
Figure 2.
Representative Depiction of the Executive Control Network (Red) and the Salience Network (Blue), Generated From Group Independent Component Analysis of the Resting State fMRI Data. Networks are overlaid onto a standard T1-weighted MNI template brain (MNI coordinates x: 0 y: 18 z: 46). ACC, anterior cingulate cortex; DLPFC, dorsolateral prefrontal cortex; IPL, inferior parietal lobule.

