Figure 2.
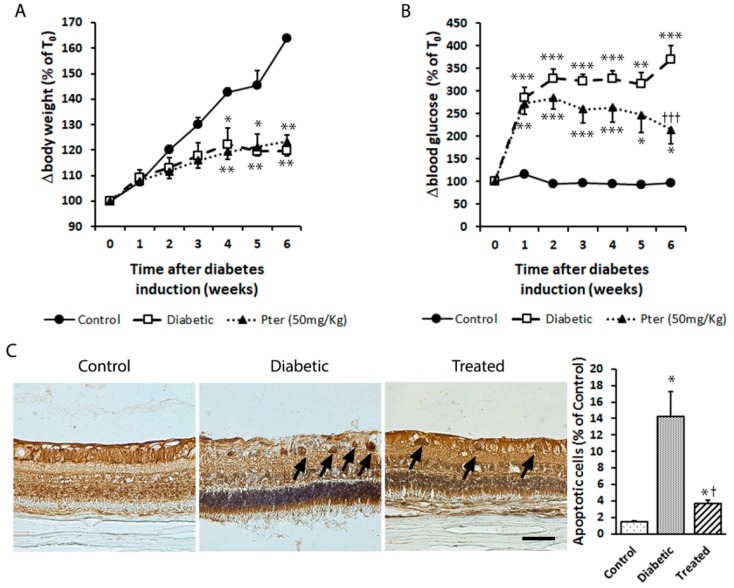
Type 1 diabetes mellitus was induced in rabbits by alloxan injection and rabbits were treated daily with Pter phosphate disodium salt (50 mg/kg of Pter) for six weeks (Treated). (A) Weight (BW) and (B) blood glucose (BG) levels were evaluated weekly. (C) Retinal apoptotic cell death was examined and quantified by TUNEL staining (black bar = 50 µm) six weeks after diabetes induction. Black arrows mark apoptotic cells. Data are presented as mean ± S.E.M. (at least n = 5 in each group). An ANOVA, followed by Tukey’s post hoc test, was used to assess significant differences between experimental conditions. * p < 0.05; ** p < 0.01; *** p < 0.001 versus the control group. † p < 0.05; ††† p < 0.001 versus the diabetic group.

