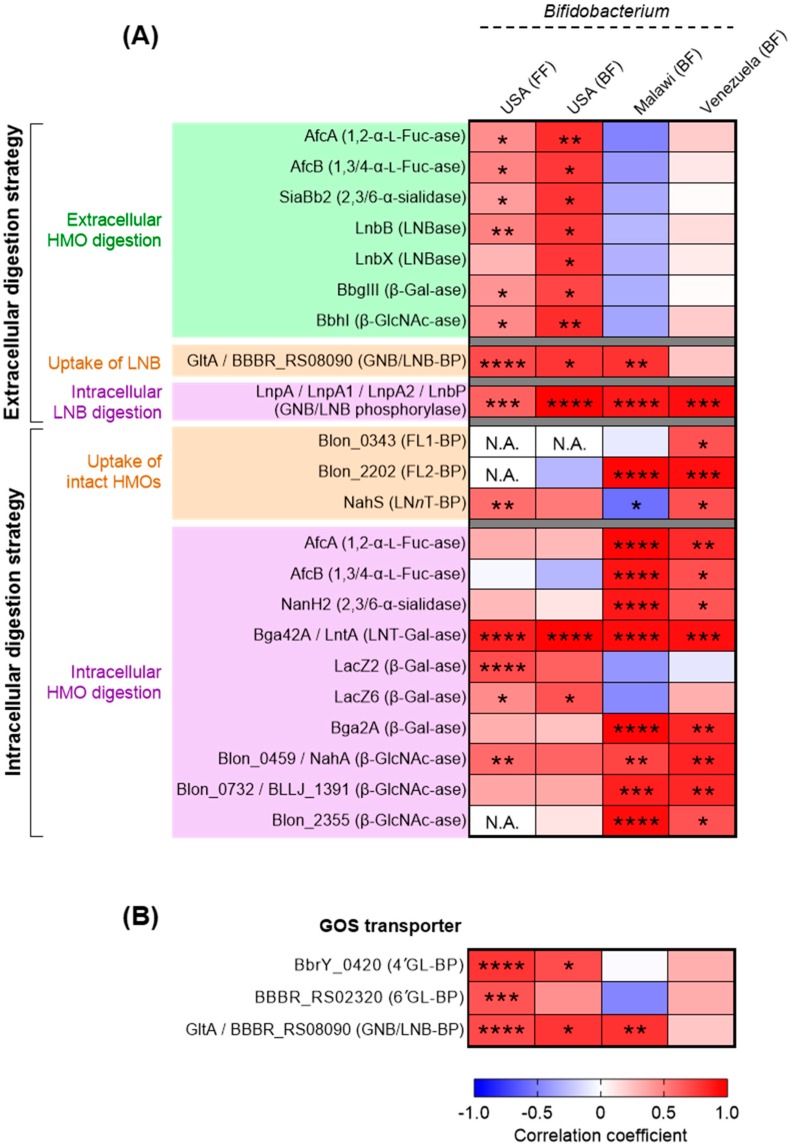
Figure 4.
Heat map showing the results of Spearman’s rank correlation coefficient analysis between the relative abundance of genus Bifidobacterium and the relative abundance of HMO (A) or GOS utilization genes (B). The fecal metagenomic data of the infants living in USA, Malawi, and Venezuela were used for the analysis. The abundance of the genus Bifidobacterium was obtained from MG-RAST version 4.0.3 (see Material and Methods). See also, Supplementary Figure S5 for HMO degradation and transport genes (A) and Supplementary Figure S6 for GOS transporter genes (B). *, **, ***, and **** denote p < 0.05, p < 0.01, p < 0.001, and p < 0.0001 respectively. BF: breast-fed; FF: formula-fed; GL-BP: galactosyllactose-binding protein; N.A.: correlation analysis was not applicable due to the absence of the reads attributable to FL1/2-BP or GlcNAc-ase (Blon_2355) genes in the tested subjects.

