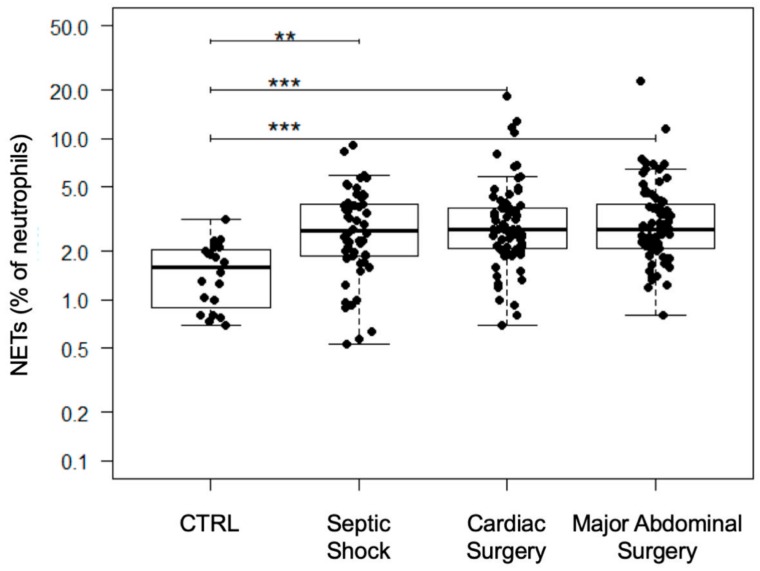
Figure 2.
Results of the NET quantification of the study groups. With the exception of preoperative values, all time points per group were summarized. Results are shown in boxplot diagrams. Asterisks display the degree of statistical significance: **: p < 0.01; ***: p < 0.001. Abbreviations: NETs: Neutrophil Extracellular Traps.

