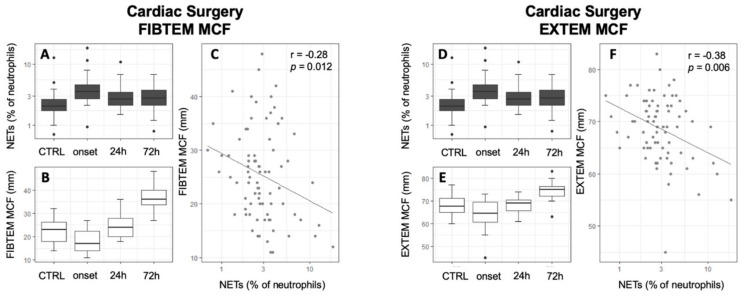
Figure 5.
Inverse correlation of free-circulating NETs to FIBTEM MCF in cardiac surgical patients. Time courses of NETs (A,D), FIBTEM MCF (B), and EXTEM MCF (E) are shown as boxplot diagrams while scatter plots are used to present correlations between NETs and FIBTEM MCF (C) and EXTEM MCF (F). Abbreviations: CTRL: Control group; MCF: Mean Clot Firmness; NETs: Neutrophil Extracellular Traps; r: Pearson’s Correlation Coefficient.

