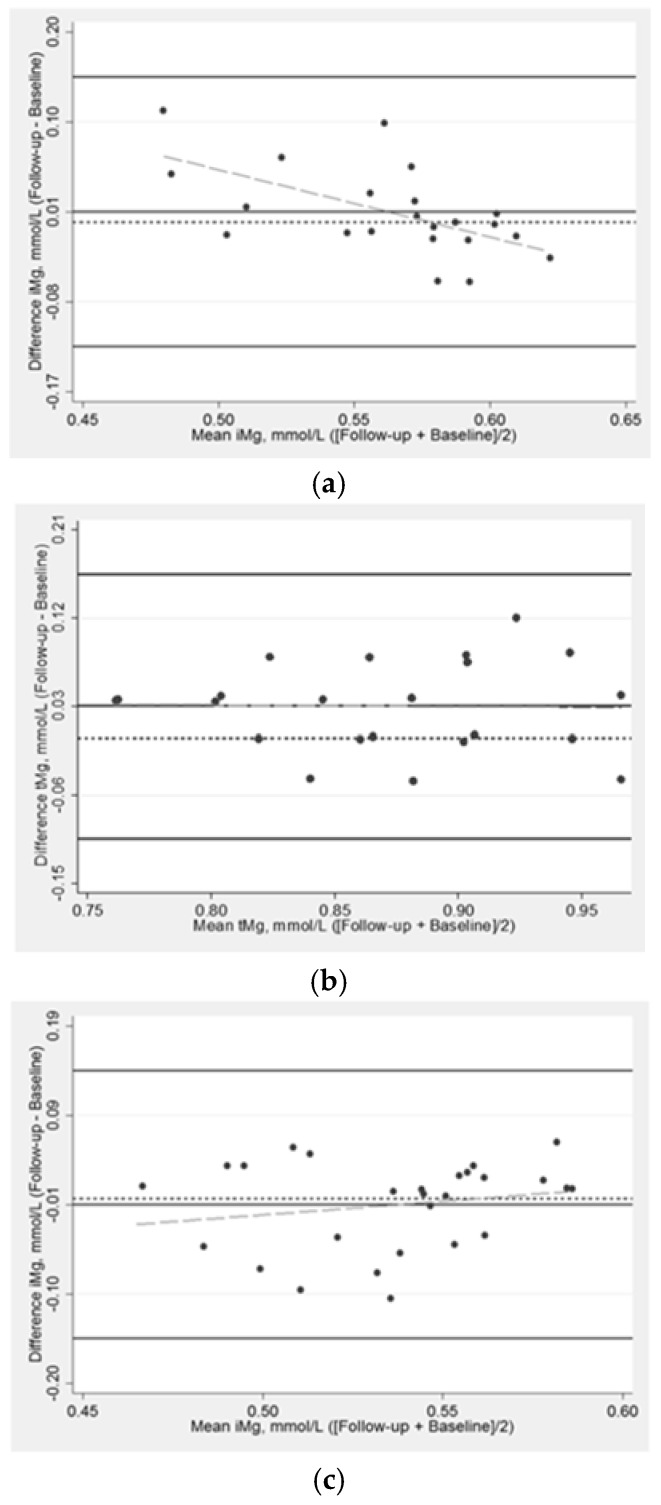
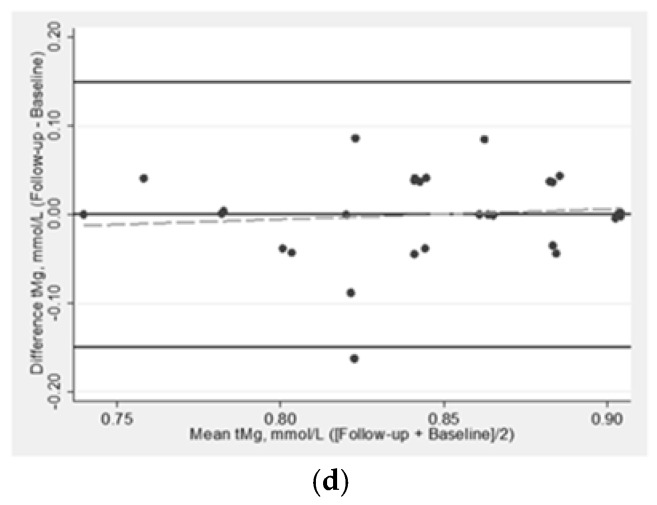
Figure 2.
Bland-Altman plot assessing the (a) change in ionized magnesium in response to magnesium supplementation over 10 weeks in the treatment arm, n = 22; (b) change in total magnesium in response to magnesium supplementation over 10 weeks in the treatment arm, n = 24; (c) change in ionized magnesium in response to magnesium supplementation over 10 weeks in the placebo arm, n = 27; (d) change in total magnesium in response to magnesium supplementation over 10 weeks in the placebo arm, n = 30. Normalized iMg concentration, which is adjusted for blood pH. Solid lines (black) are the mean difference ± 3 standard deviations; the long dash line (gray) is the fitted values; the short dash line (black) is the reference line for the mean difference of 0 mmol/L.


