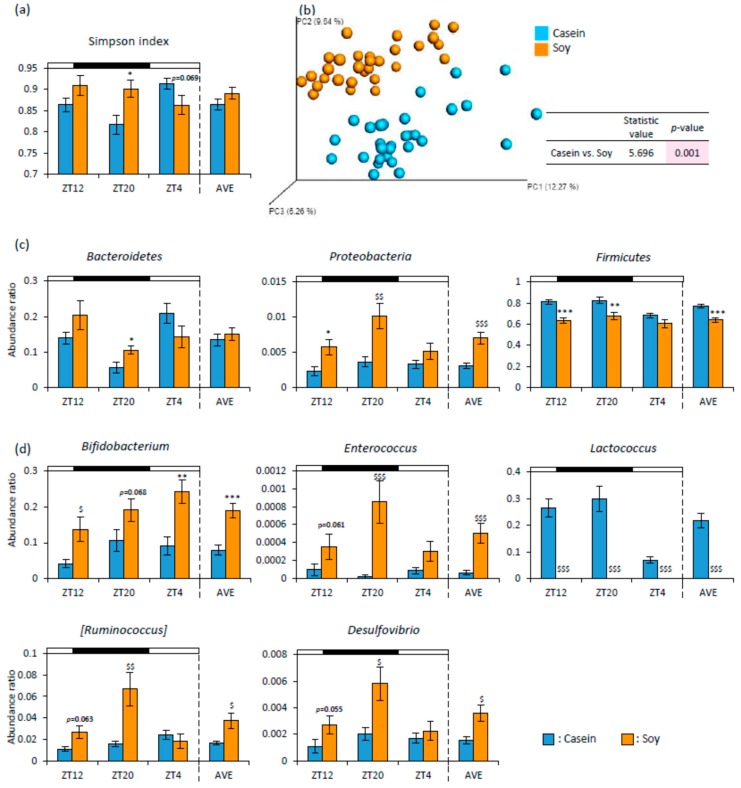
Figure 4.
The effect of soy protein intake on microbiota. (a) Alpha-diversity about Simpson index (ZT12, ZT20, ZT4, and an average of three points) of mice that were fed each diet for 10 days. (b) Beta-diversity in comparison of each diet. The PCoA plots of unweighted UniFrac distance metrics obtained from sequencing the 16S rRNA gene in feces (n = 30). (c) The relative abundance of microbes at the Phylum level, and (d) at the Genus level of mice that were fed each diet for 10 days (ZT12, ZT20, ZT4, and an average of three points). Data (a,c,d) are represented as mean ± SEM (n = 10). * p < 0.05, ** p < 0.01, *** p < 0.001 versus Casein, evaluated using Student’s t-test. $ p < 0.05, $$ p < 0.01, $$$ p < 0.001 versus Casein, evaluated using the Mann-Whitney test. The table in (b) indicates the result using PERMANOVA.

