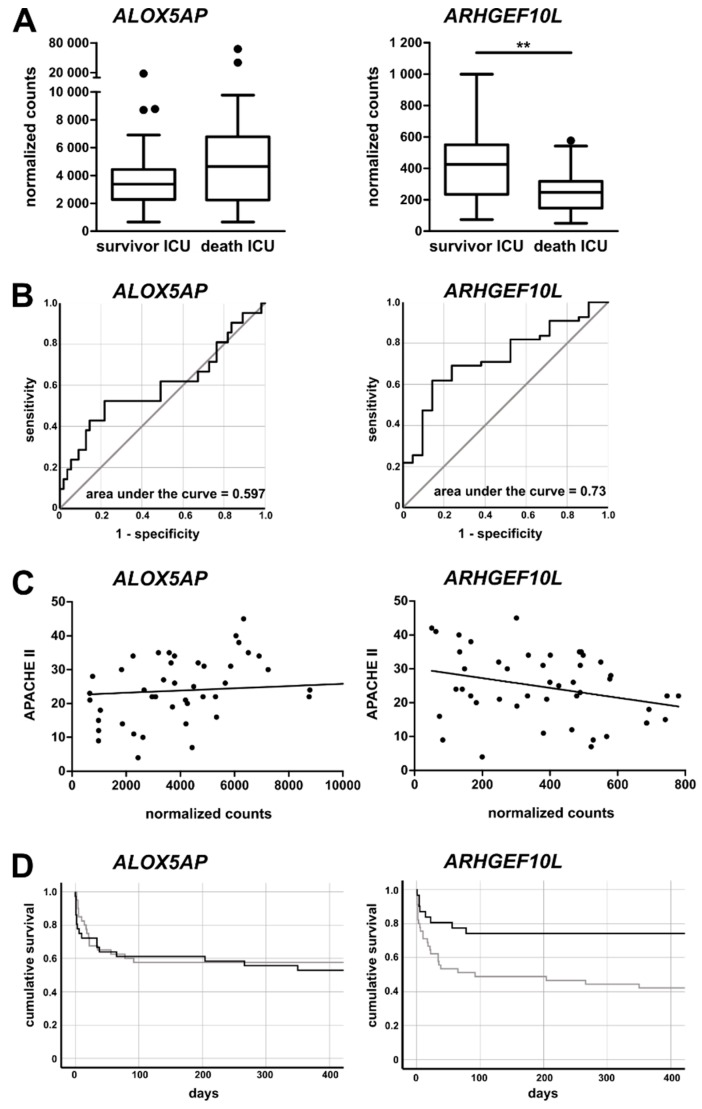
Figure 7.
Correlation of mRNA expression with survival and prognosis for intensive care patients. (A) Expression of ALOX5AP and ARHGEF10L mRNA in CD14+ monocytes from intensive care patients surviving and not surviving their ICU stay. (B) Receiver operating characteristic (ROC) curve analysis. (C) Correlation analysis of APACHE II score with mRNA expression of ALOX5AP in monocytes from ICU patients (left panel, three values out of range are included in the analysis, but not displayed in the graph) and ARHGEF10L (right panel). (D) Kaplan–Meier survival curves for ICU patients. Left: ALOX5AP expression <3681.75 counts (grey line) or ≥3681.75 counts (black line), Log rank 0.238, p = 0.625; Right: ARHGEF10L expression < 413,265 counts (grey line), black ≥ 413,265 counts (black line), Log rank 6.978, p = 0.008. Statistics: ** indicates p < 0.01. For a comparison of two groups, the Mann–Whitney U test was used. Sample sizes: survivor ICU n = 55 and death ICU n = 21.

