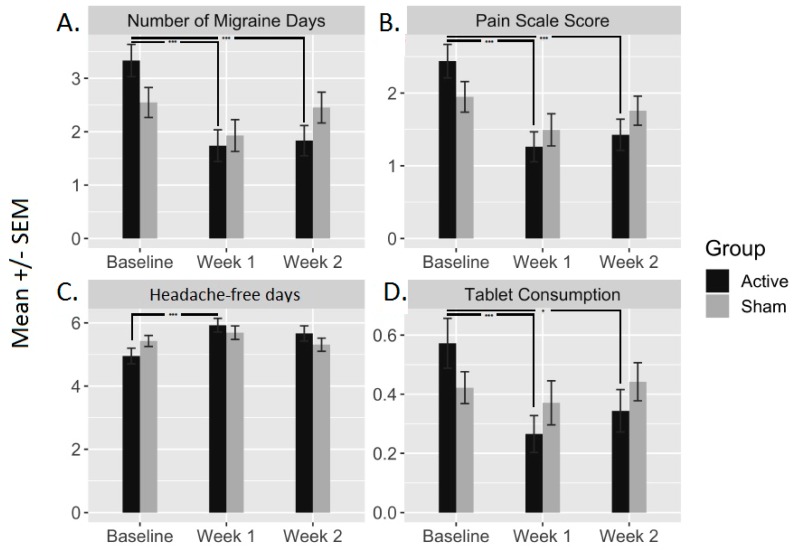
Figure 2.
The bar plots represent the mean ± standard error of the mean (SEM) of the four output measures before (baseline) and after (week 1 and week 2) active and sham conditions. These output measures are (A) number of migraine days, (B) pain scale scores (VAS), (C) headache-free days and (D) tablets consumption. *** indicates a significance <0.001; * indicates a significance <0.05.

