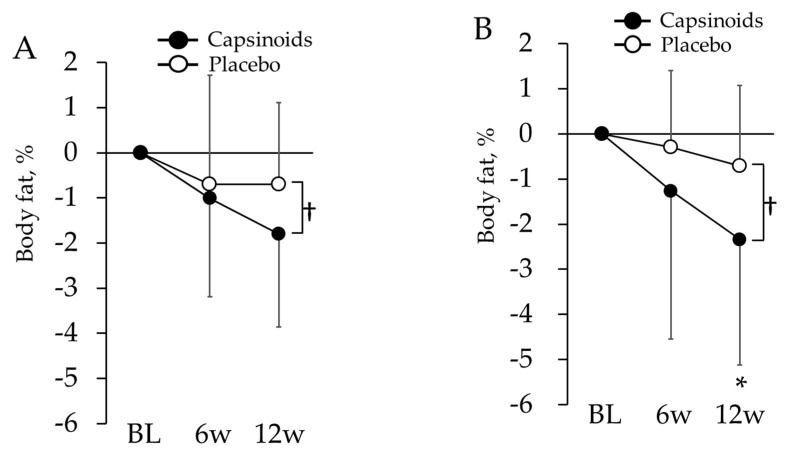
Figure 3.
Changes in body fat from BL in all subjects (A) and overweight subjects (B). The values are the differences from baseline value. The error bars represent standard deviation. Body fat in capsinoids group was lower than placebo group at the 12th week († p < 0.05). In overweight subjects, it also showed significant change in capsinoids group compared with placebo group at the 12th week (* p < 0.05).

