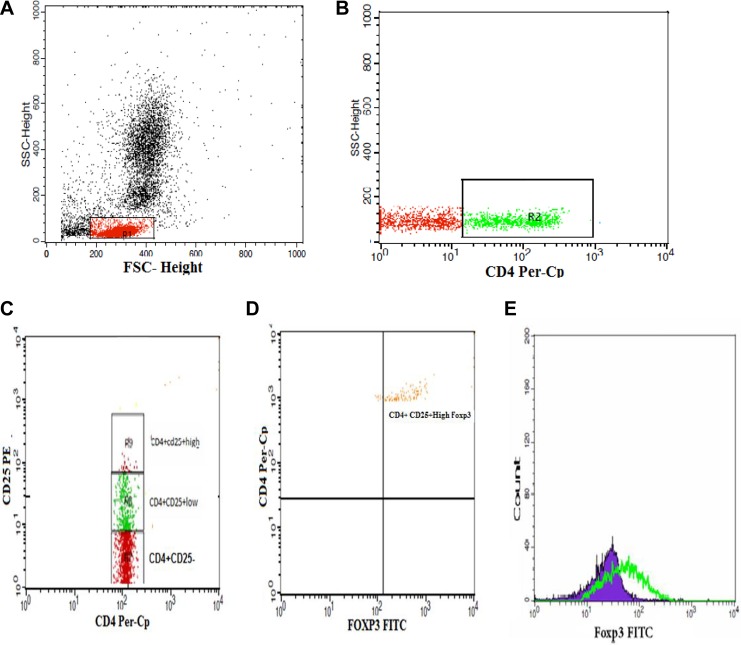
Figure 1.
Flow cytometric detection of regulatory T-cells. A, Forward and side scatter histogram was used to define the lymphocytes population (R1). B, The expression of CD4 on the lymphocyte population was then gated. C, The expression of CD25 was then assessed on CD4+lymphocytes, and different gates were drawn to define CD4+ CD25− cells, CD4+CD25+low cells, and CD4+CD25+high cells. D, Then, the percentage of CD4+CD25+high Foxp3+cells was determined. E, The expression of Foxp3+ on CD4+CD25+high cells as a geometric mean of fluorescence intensity.

