Figure 3.
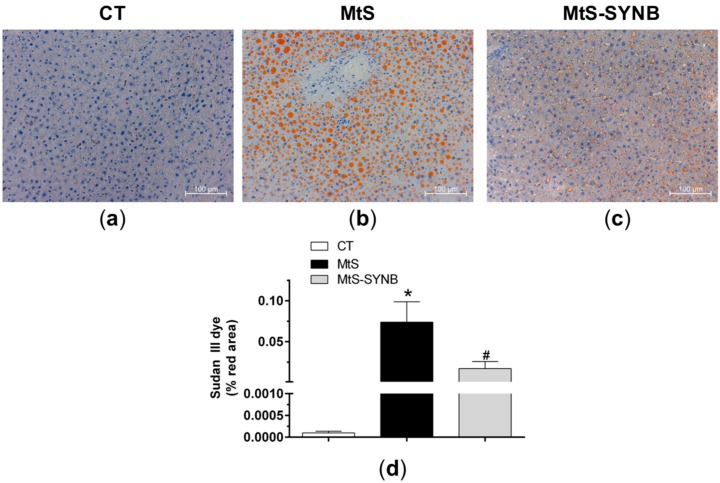
Liver sections were stained with Sudan III lipid dye. Representative images (20 × magnification) from CT (a), MtS (b) and MtS-SYNB (c) rats are shown. The scale bar represents 100 µm. (d) Quantitative analysis of Sudan III lipid dye staining. Results are represented as % of stained area (mean ± S.E.M). Statistical analysis: One-way ANOVA followed by a Newman–Keuls post-hoc test. * p < 0.05 CT vs. MtS; # p < 0.05 MtS vs. MtS-SYNB.

