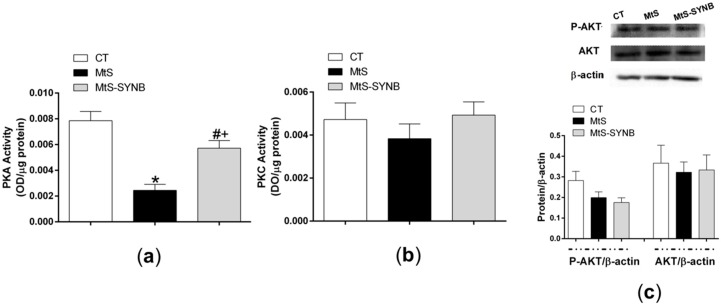
Figure 8.
(a) PKA activity, and (b) PKC activity in mesenteric arteries from CT, MtS and MtS-SYNB rats. Results are represented as optical density (OD) units/µg protein (mean ± S.E.M). Statistical analysis: One-way ANOVA followed by a Newman–Keuls post-hoc test. * p < 0.05 CT vs. MtS; # p < 0.05 MtS vs. MtS-SYNB; + p < 0.05 CT vs. MtS-SYNB. (c) Western blot analysis for total AKT (AKT) and phosphorylated AKT at the T308 residue (P-AKT) in mesenteric arteries from CT, MtS and MtS-SYNB rats. Each lane is representative of eight isolated arterial segments from different animals in each group. Lower graph shows densitometric analyses of the protein expression. Results (mean ± S.E.M) are expressed as protein expression relative to β-actin expression.

