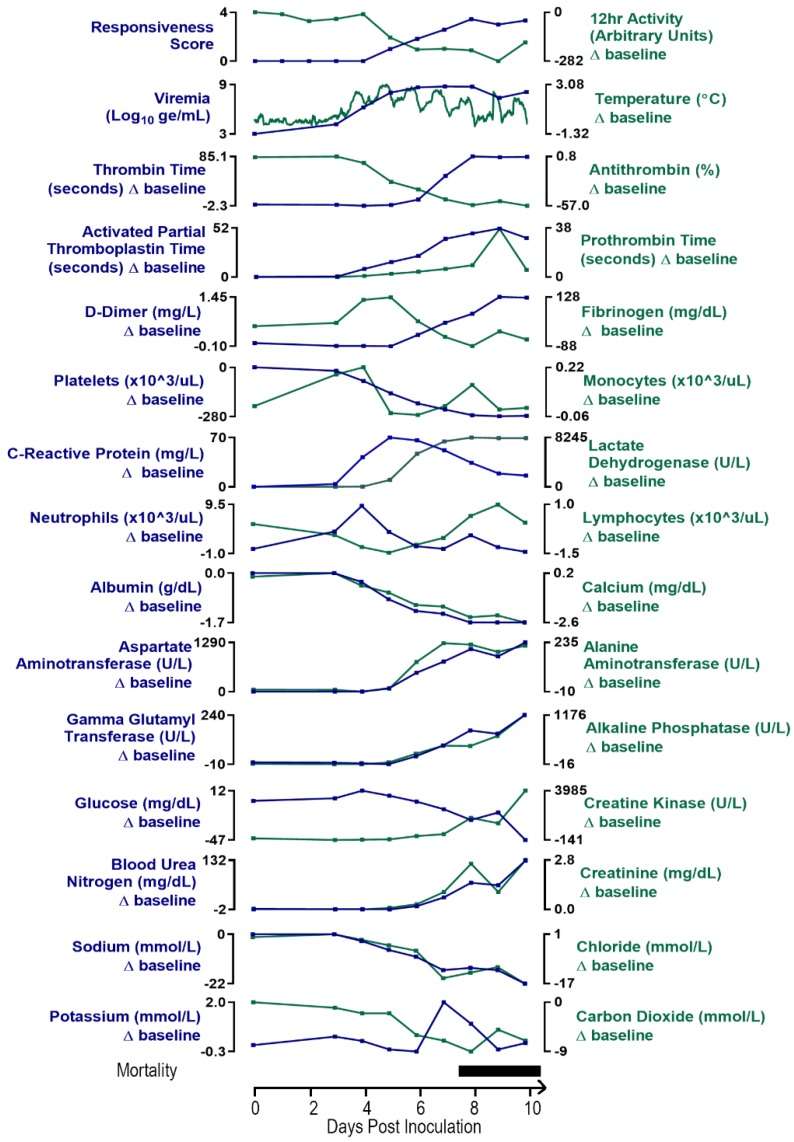
Figure A1.
Clinical signs, viremia, and clinical pathology alterations in rhesus macaques exposed to IM EBOV. Data represent the mean for EBOV-exposed animals. Mean responsiveness score was derived from the individual animal maximum daily responsiveness score. The 12-h activity was derived from individual animal physical movements assessed via telemetry, averaged over the 12-h interval corresponding to the animal room light cycle (dark-cycle activity is not shown). For plasma viral RNA concentrations, EBOV RNA values below the LOD were imputed as 3.000 log10 ge/mL; values above the LOD but below the LLOQ were imputed as 4.903 log10 ge/mL. Temperature represents 30-min body temperature averages. X-axes are truncated to highlight responses occurring from the first sampling point through the acute disease phase. Error bars were omitted for clarity. The horizontal mortality bar indicates the range of timing in which animals succumbed.

