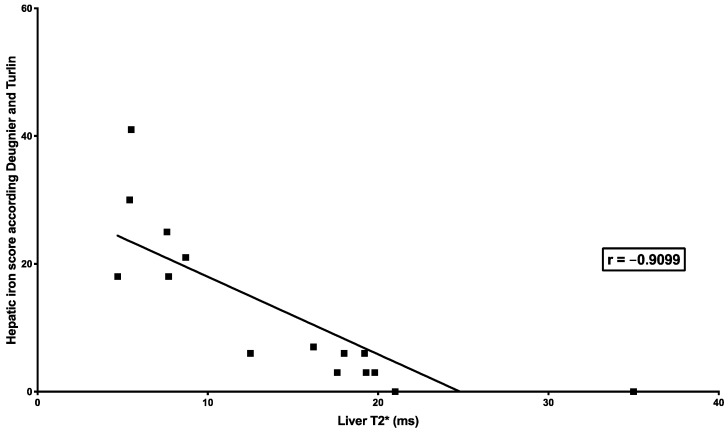
Figure 2.
Correlation between liver iron concentration measured by R2* relaxometry (classical) MRI and Deugnier’s and Turlin’s histological scoring. The figure shows the relationship between T2* measured by R2* relaxometry (classical) and iron histological scoring successfully performed in 15 liver biopsies (out of 18). The relationship was studied by Spearman’s rank correlation test, which showed a very high correlation (r = −0.9099; p < 0.0001).

