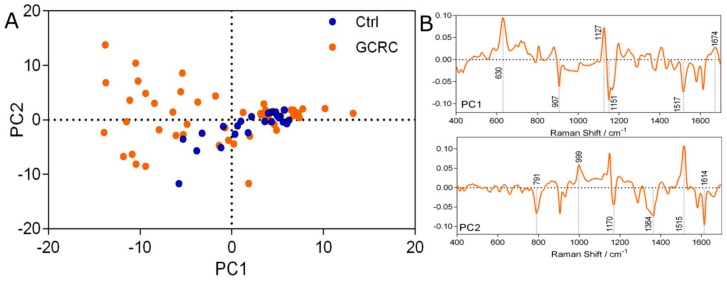
Figure 3.
Principal component analysis (PCA) of the SERS spectra of serum. (A) The first two principal components (PCs) of PCA shows the clustering of the SERS spectra of serum from 25 control subjects (Ctrl) and 53 patients with gastric and colorectal cancer (GCRC). (B) The corresponding loading plots of PC 1 and PC 2.

