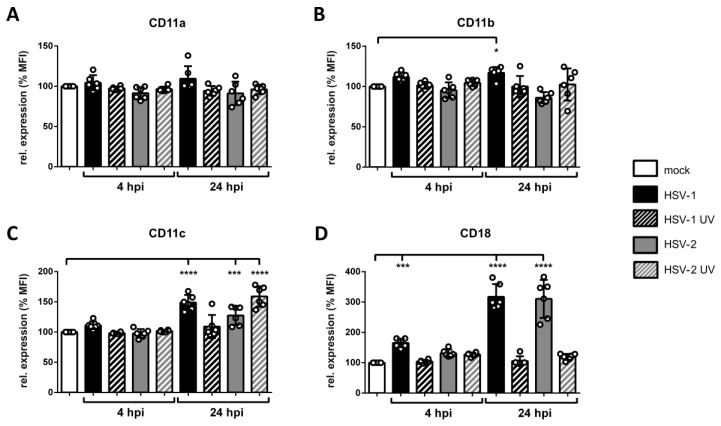
Figure 7.
Expression levels of β2 integrin subunits are differentially regulated on HSV-2 infected mDCs 4 hpi and 24 hpi. Mock-, HSV-1- (MOI of 1), HSV-1 UV- (MOI of 1; 1.200 J/cm2), HSV-2- (MOI of 5), or HSV-2 UV- (MOI of 5; 1.200 J/cm2) infected mDCs were harvested 4 hpi and 24 hpi. Cells were stained with antibodies specific for (A) CD11a, (B) CD11b, (C) CD11c, or (D) CD18 and analyzed via flow cytometry. Panels show data as mean fluorescence intensity (MFI) for HSV-1- (black filled bars), HSV-1 UV- (black striped bars), HSV-2 (gray filled bars), or HSV-2 UV- (gray striped bars) infected mDCs relative to mock cells (white bars; set to 100%). Error bars indicate ± SD. Significant changes (**** = p < 0.0001; *** = p < 0.001; * = p < 0.05) are marked by asterisks. The experiment was performed six times with cells from different healthy donors.

