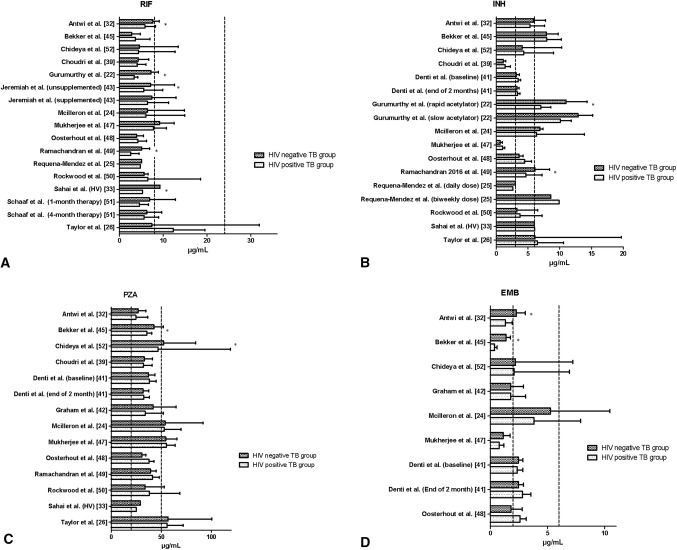
Fig. 3.
Histograms of the mean or median peak drug concentration for the HIV-negative and HIV-positive TB groups per study for a rifampicin, b isoniazid, c pyrazinamide and d ethambutol. Asterisk indicates statistical significance. The dashed lines represent the generally cited reference ranges by Peloquin [27]: rifampicin 8–24 µg/mL; isoniazid 3–6 µg/mL; pyrazinamide 20–50 µg/mL; ethambutol 2–6 µg/mL. The study by Sahai et al. [33] compared HIV-infected individuals without TB with healthy HIV-uninfected volunteers (healthy volunteers). INH isoniazid, RIF rifampicin, PZA pyrazinamide, EMB ethambutol, TB tuberculosis

