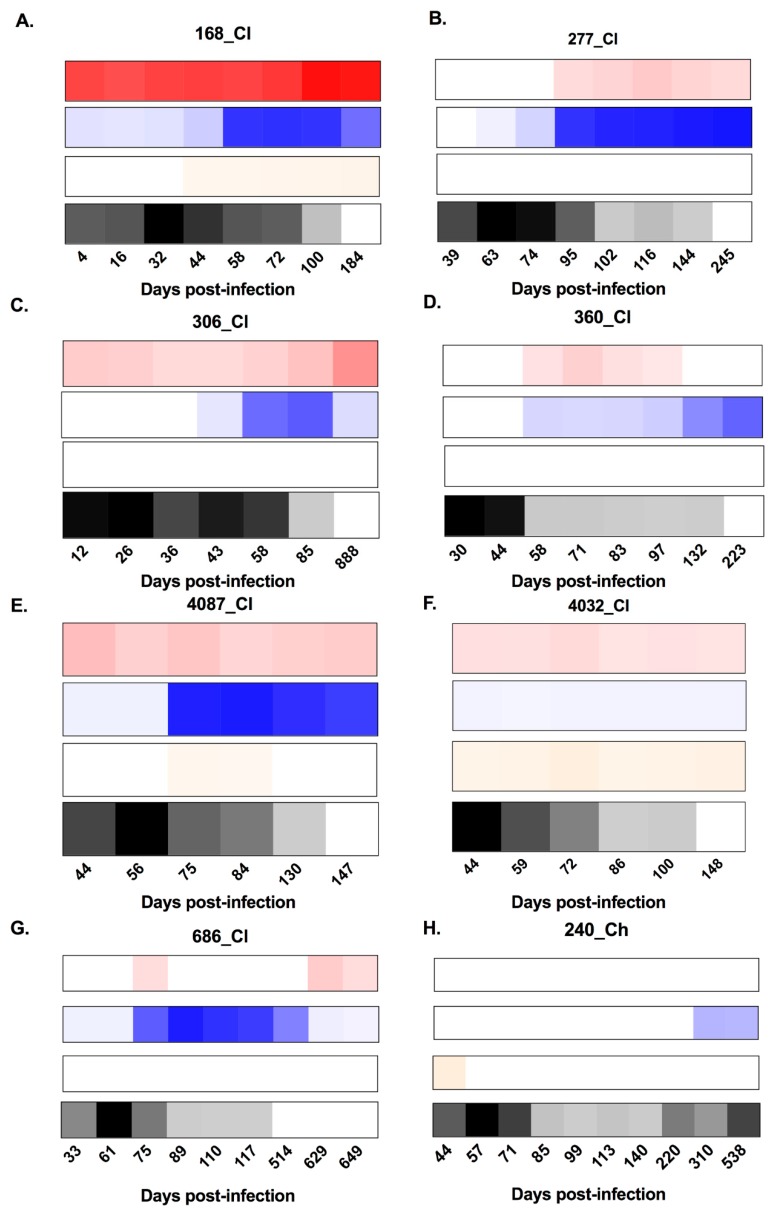
Figure 1.
Heat maps representing the longitudinal patterns of anti-hepatitis C virus (HCV) envelope protein 2 (E2)-antibody isotype utilisation (signal/noise) for anti-E2 immunoglobulin M (IgM), IgG, and IgA responses, as well as HCV RNA levels (IU/mL). Panels A–G show subjects who cleared the infection. Panels H–N show subjects who developed chronic hepatitis. IgM is represented in red, IgG is represented in blue, IgA is represented in orange, and longitudinal HCV RNA levels (IU/mL) are represented in black (see key). Days post infection (DPI) are indicated below each heat map. All results were generated in duplicate from longitudinal serum samples collected for each subject.


