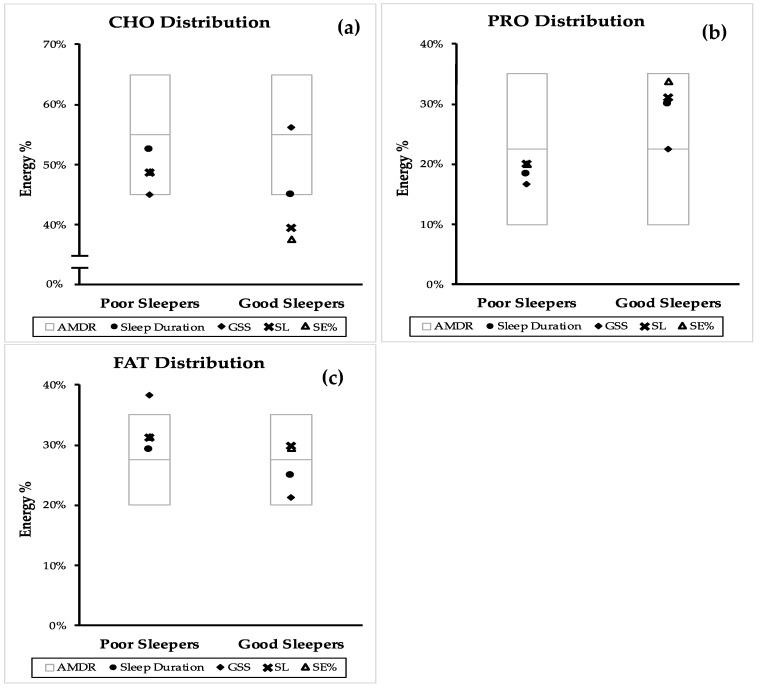
Figure 2.
Comparison of good and poor sleep macronutrient distribution with the accepted macronutrient distribution (AMDR)* from randomized controlled trials (RCT). Macronutrient distribution are presented as mean energy percentage values generated from sleep duration, PSQI, sleep latency (SL) and sleep efficiency (SE%). (a) dietary carbohydrate (CHO) distribution, (b) dietary protein (PRO) distribution and (c) dietary fat (FAT) distribution. AMDR is presented as area within the box plot.

