
Fig. 1.
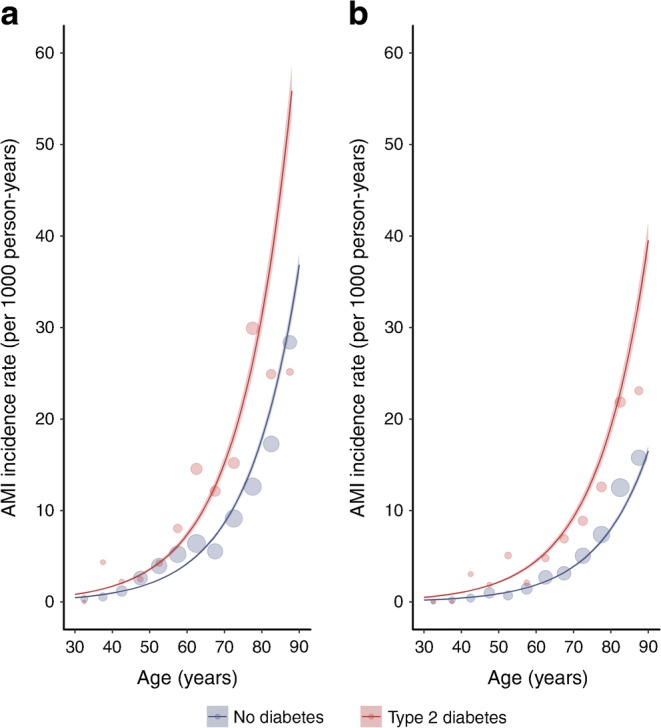
Incidence of AMI by diabetes status, sex and age in years. The graphs illustrate modelled rates for (a) men and (b) women in deprivation decile 5 in the calendar year 2010 using negative binomial models. The shading shows 95% CIs. Points represent event rates stratified by age in 5-year bands, sex and diabetes diagnosis; the size of the points reflects the size of the denominator