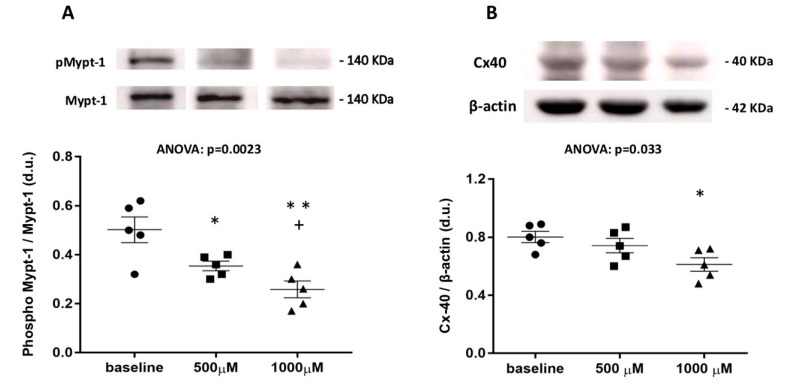
Figure 3.
(A) Densitometric analysis of phospho-MYPT-1 in mononuclear cells of five DPAFs after incubation with 500 and 1000 μM of fasudil. The top of the figure shows phosphorylated phospho-MYPT-1 western blot products from one representative patient out of five. **: p = 0.005 vs. baseline; +: p = 0.04 vs. 500 μM; *: p = 0.03 vs. baseline. (B) densitometric analysis of connexin 40 in mononuclear cells of five DPAFs after incubation with 500 and 1000 μM of fasudil. The top of the figure shows connexin 40 western blot products from one representative patient out of five. *: p = 0.014 vs. baseline.

