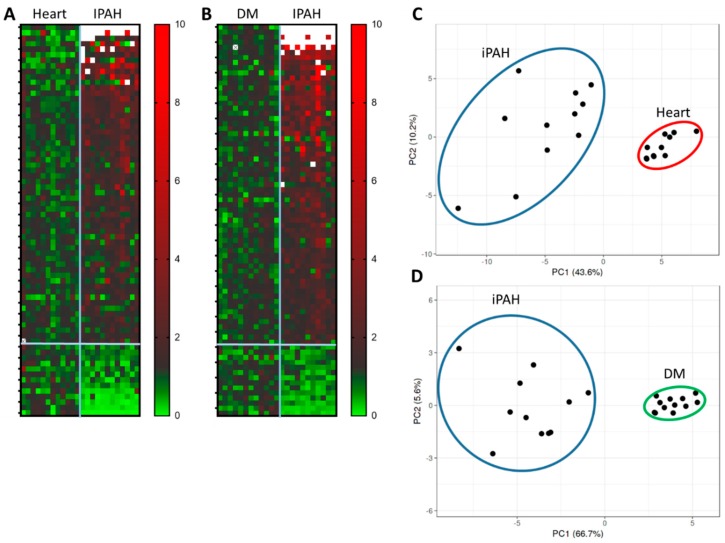
Figure 1.
Metabolic profiling of plasma of pulmonary arterial hypertension (PAH) patients (n = 11), and comparison with diabetes mellitus (DM; n = 12) and left heart disease (heart; n = 11) patients. Our data indicate significantly (p < 0.05) altered metabolites in PAH vs. heart and PAH vs. DM analysis. (A,B) Heat maps and (C,D) principal component analysis (PCA) show the clustering of the PAH group that could differentiate PAH patients from DM and heart by circulating metabolites. Ellipses indicate the area of a 0.95 probability that the metabolic profiling of the patient from the same group will be inside an ellipse.

