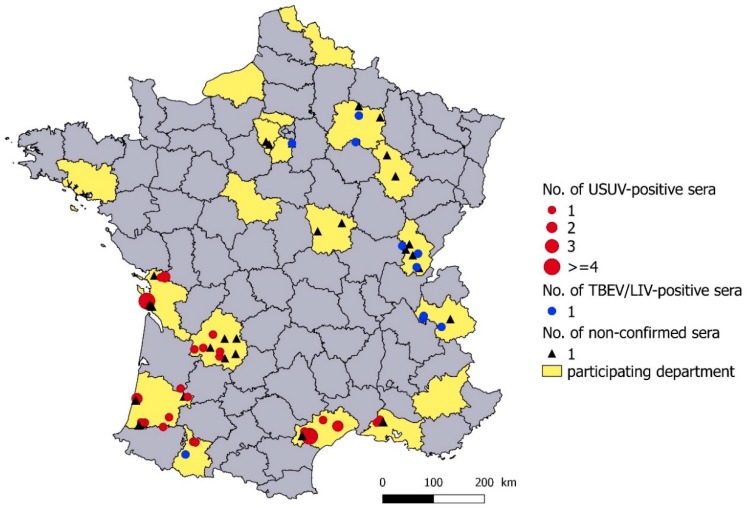
Figure 2.
Geographical distribution of USUV-positive and TBEV/LIV-positive serum samples by virus micro-neutralization test (MNT) or xMAP microsphere immunoassay (MIA), and unidentified flavivirus-positive serum samples in cELISA and negative or not tested by MNT and MIA. The number represents the number of serum samples per municipality.

