Figure 1.
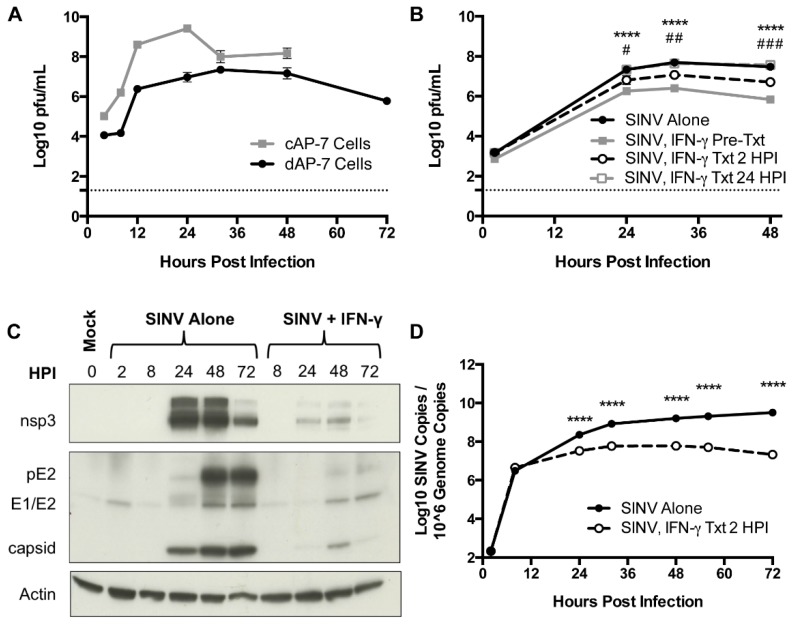
SINV replication in neurons in vitro and the effect of IFN-γ. (A) Infectious virus was measured by plaque assay after infection of cAP-7 (gray line) and dAP-7 (black line) cells infected with SINV TE at a MOI of 5. (B) dAP-7 cells were infected with SINV TE at a MOI of 1 and treated with 500 U/mL IFN-γ 2 h prior to infection (gray square and solid line; SINV, IFN-γ Pre-Txt), at 2 HPI (white circle and black dashed line; SINV, IFN-γ Txt 2 HPI), at 24 HPI (white square and gray dashed line; SINV, INF-γ Txt 24 HPI) or untreated (black circle and solid line; SINV Alone) (n = 3 replicates per cell type per treatment group; data are representative of two (A) or three (B) independent experiments and are presented as the mean ± SEM; dashed line indicates level of detection; **** p < 0.0001, SINV Alone vs. SINV, IFN-γ Pre-Txt; # p < 0.05, ## p < 0.01, ### p < 0.001, SINV Alone vs. SINV, IFN-γ Txt 2 HPI by Tukey’s multiple comparisons test). (C,D) dAP-7 cells were infected with SINV at a MOI of 1 and either left untreated or treated with 500 U/mL IFN-γ at 2 HPI. (C) Nonstructural (nsp3) and structural (pE2, E1/E2, capsid) SINV protein production was evaluated by western blot using β actin as control. (D) Viral RNA levels were evaluated by qPCR in untreated (black circle and solid line) and IFN-γ-treated (white circle and black dashed line) dAP-7 cells (n = 3 replicates per treatment group; data are representative of two independent experiments and are presented as the mean ± SEM; **** p < 0.0001, by Bonferroni’s multiple comparisons test).

