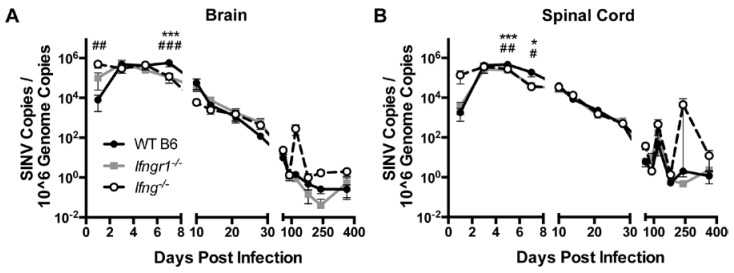
Figure 5.
Effect of IFN-γ signaling on viral RNA clearance in vivo. Viral RNA levels were examined by qRT-PCR in brains (A) and spinal cords (B) of WT (black circle and solid line), Ifngr1−/− (gray square and solid line), and Ifng−/− (white circle and black dashed line) mice (n = 3–8 mice per strain per time point; data are presented as the mean ± SEM; * p < 0.05, *** p < 0.001, WT vs. Ifngr1−/−; # p < 0.05, ## p < 0.01, ### p < 0.001, and WT vs. Ifng−/−, all by Tukey’s multiple comparisons test).

