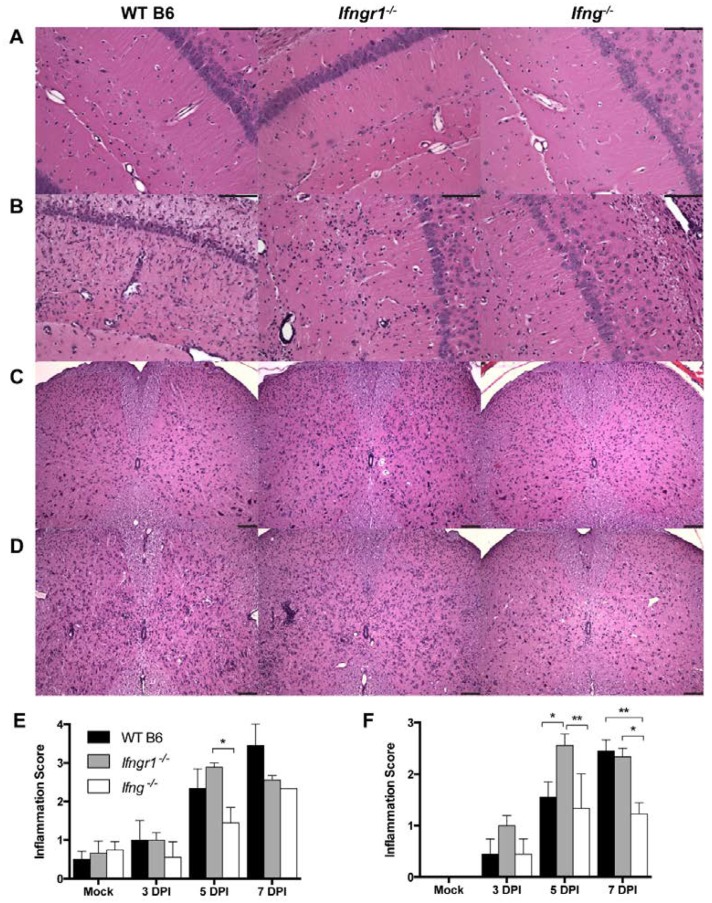
Figure 6.
Inflammation in the brain and spinal cord of SINV-infected WT, Ifngr1−/−, and Ifng−/− mice. (A–D) Representative photomicrographs were taken of H&E-stained brain (A,B) and spinal cord (C,D) sections from mock-infected mice (A,C) and SINV-infected mice at 7 DPI (B,D) (brain = 200× magnification and spinal cords = 100× magnification, scale bar = 100 μm). (E,F) H&E sections of brains (E) and spinal cords (F) of WT (black bars), Ifngr1−/− (gray bars), and Ifng−/− (white bars) mice either mock-infected or SINV-infected at 3, 5 or 7 DPI were scored for inflammation using a four-point (brain) or three-point (spinal cord) system (data are presented as the mean score ± SEM for 3–4 mice per strain per group; * p < 0.05 and ** p < 0.01, Tukey’s multiple comparisons test).

