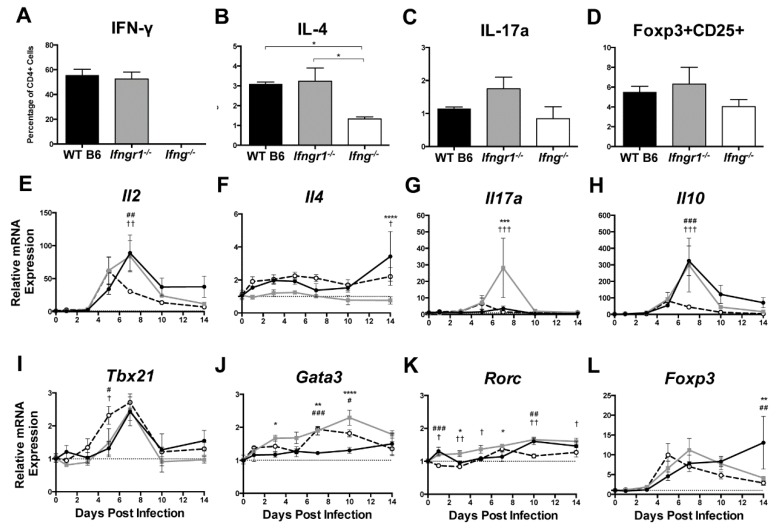
Figure 8.
T helper cell profiles in brains of SINV-infected mice with impaired IFN-γ signaling. Flow cytometry was used to examine the percentage of CD4+ T cells producing IFN-γ (A), IL-4 (B), IL-17a (C), or expressing both Foxp3 and CD25 (D) in WT (black bars), Ifngr1−/− (gray bars), and Ifng−/− (white bars) mice at 7 DPI. These markers denoted Th1, Th2, Th17, and Treg cell populations, respectively (n = 3–7 pooled mice per strain per time point from three independent experiments; data are presented as the mean SEM; * p < 0.05 by Dunn’s multiple comparisons test). (E–L) Relative mRNA expression of Il2 (E), Il4 (F), Il17a (G), Il10 (H), Tbx21 (I), Gata3 (J), Rorc (K), and Foxp3 (L) were examined by qRT-PCR in WT (black circle and solid line), Ifngr1−/− (gray square and solid line), and Ifng−/− (white circle and black dashed line) mouse brains (n = 3–4 mice per strain per time point; data are presented as the mean ± SEM; dashed line indicates gene expression of 0 DPI tissue for each strain to which other time points were normalized; * p < 0.05, ** p < 0.01, *** p < 0.001, **** p < 0.0001, WT vs. Ifngr1−/−; # p < 0.05, ## p < 0.01, ### p < 0.001, WT vs. Ifng−/−, † p < 0.05, †† p < 0.01, ††† p < 0.001, and Ifngr1−/− vs. Ifng−/−, all by Tukey’s multiple comparisons test).

