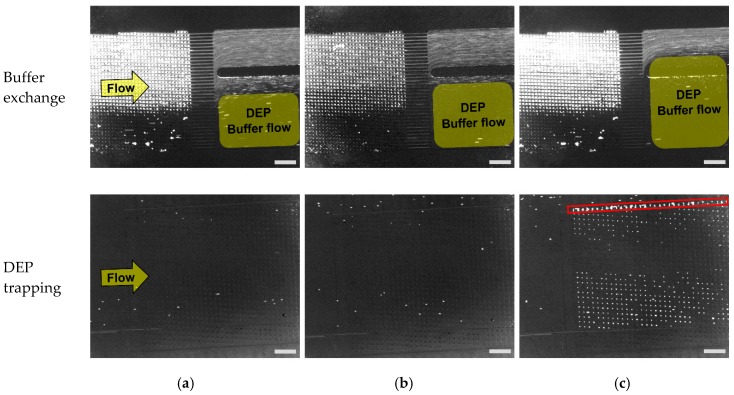
Figure 7.
Buffer exchange in the DLD module (above), and the trapping of PC3 cells in a microwell array (below) for various Inlet 2 flow rates, scale bar: 500 μm. PC3 cells: stained with CellTrace™ Calcein Red-Orange fluorescent dye (emission wavelength: 590 nm). Microbeads: Fluoresbrite® YO carboxylate microspheres (emission wavelength: 546 nm). (a) Flow rate: 1.5 μL/min; (b) Flow rate: 2 μL/min; (c) Flow rate: 2.5 μL/min.

