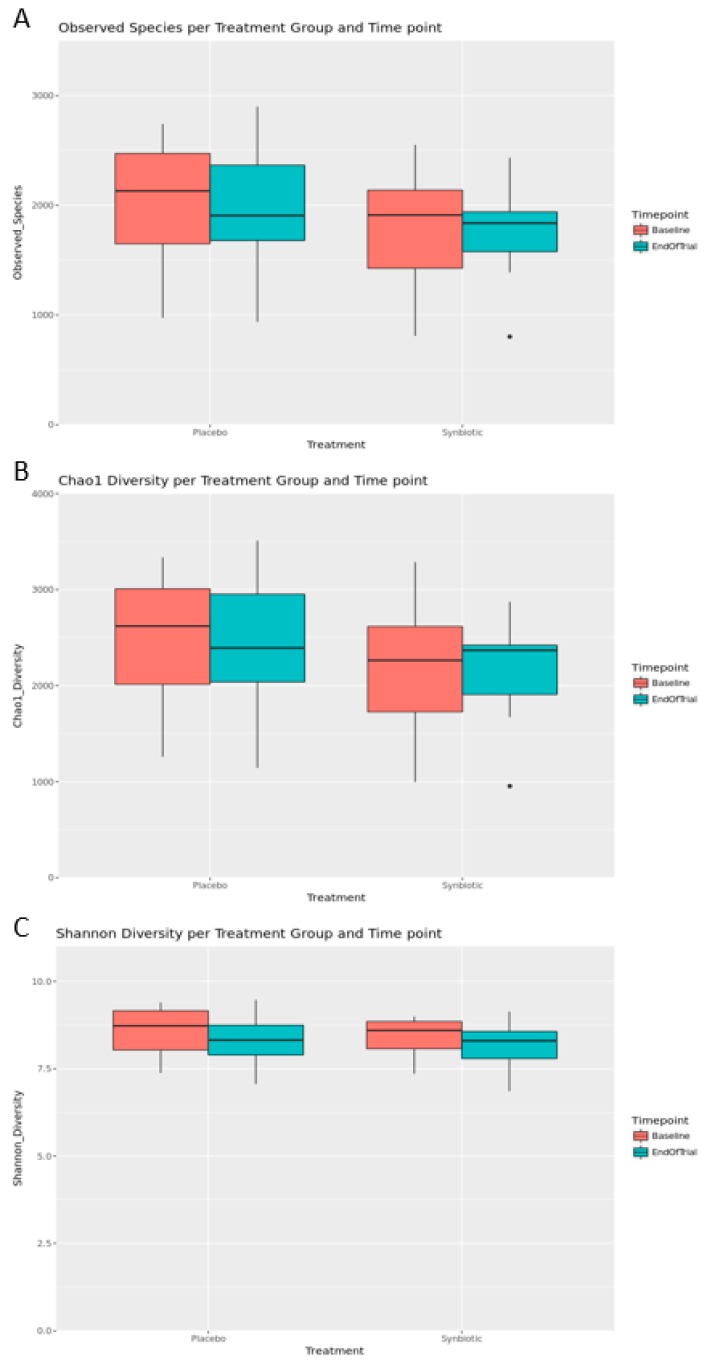
Figure 3.
Observed species (A), Chao1 diversity (B) and Shannon diversity (C) plotted by the treatment group and time point. The box spans the first and third quartiles. A horizontal line marks the median and the whiskers represent ±1.5 times the interquartile range. Outliers (panels A and B) are marked as individual points. Significant differences between groups were determined using the estimated marginal means analysis applied to linear mixed model, which was built with alpha diversity as the response variable, the treatment group and time points as predictor variables, and subject number as a random variable.

