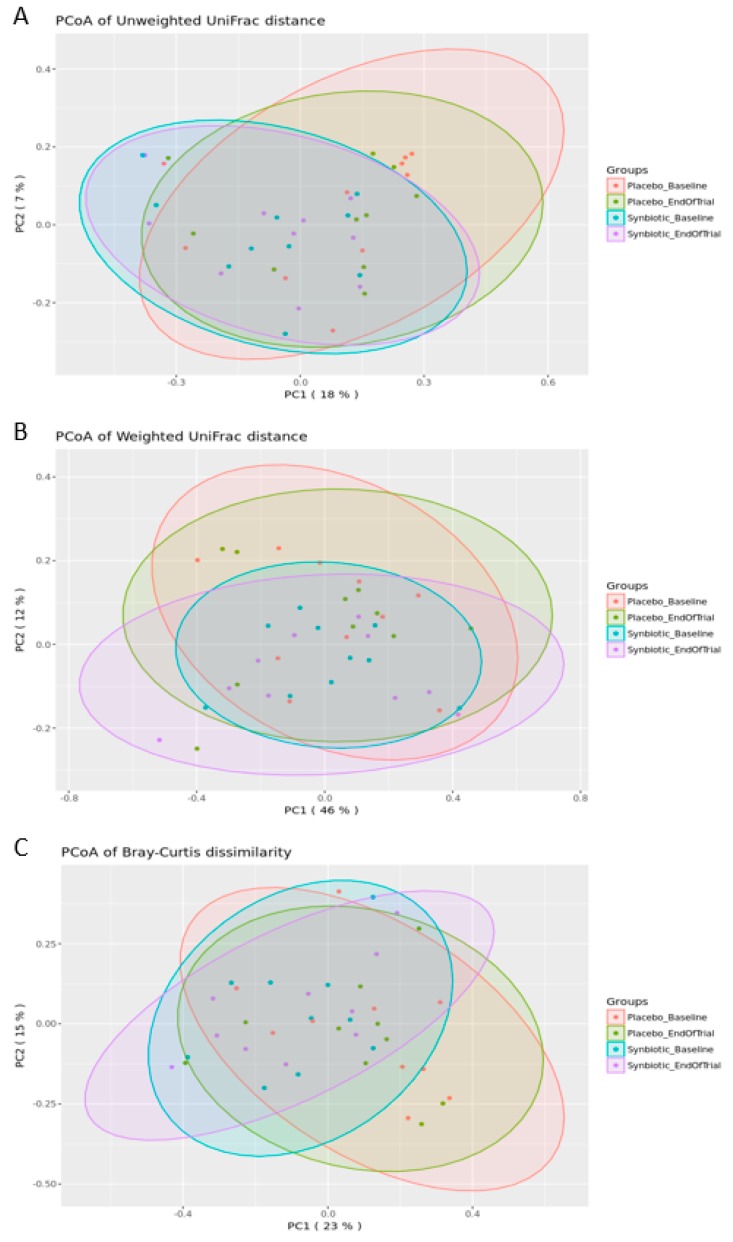
Figure 4.
Principal Coordinates Analysis (PCoA) of unweighted UniFrac (A), weighted UniFrac (B) and Bray–Curtis dissimilarity data (C). The scatter plots show principal coordinate 1 (PC1) vs. principal coordinate 2 (PC2) with percentages of variation explained by the components indicated. The points are colored by the treatment group and time point.

